Six billion tonnes a second: rogue planet Cha 1107-7626 found growing at record rate
Astronomers have identified an enormous ‘growth spurt’ in a so-called rogue planet. Unlike the planets in our Solar System, these objects do not orbit stars, free-floating on their own instead. The new observations, made with the European Southern Observatory’s Very Large Telescope (ESO’s VLT), reveal that this free-floating planet is eating up gas and dust from its surroundings at a rate of six billion tonnes a second. This is the strongest growth rate ever recorded for a rogue planet, or a planet of any kind, providing valuable insights into how they form and grow.
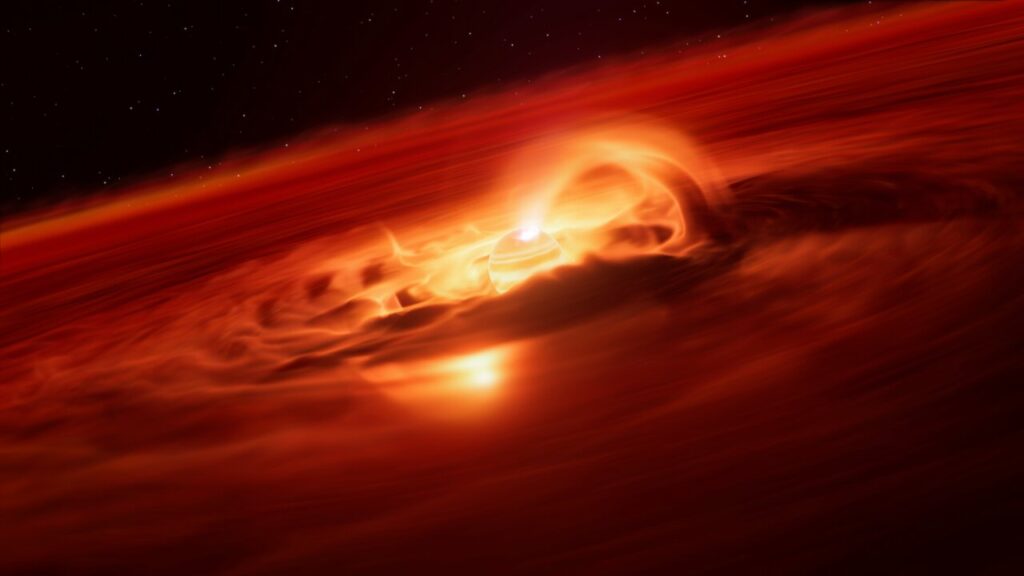
Credit: ESO/L. Calçada/M. Kornmesser
“People may think of planets as quiet and stable worlds, but with this discovery we see that planetary-mass objects freely floating in space can be exciting places,”
says Víctor Almendros-Abad, an astronomer at the Astronomical Observatory of Palermo, National Institute for Astrophysics (INAF), Italy and lead author of the new study.
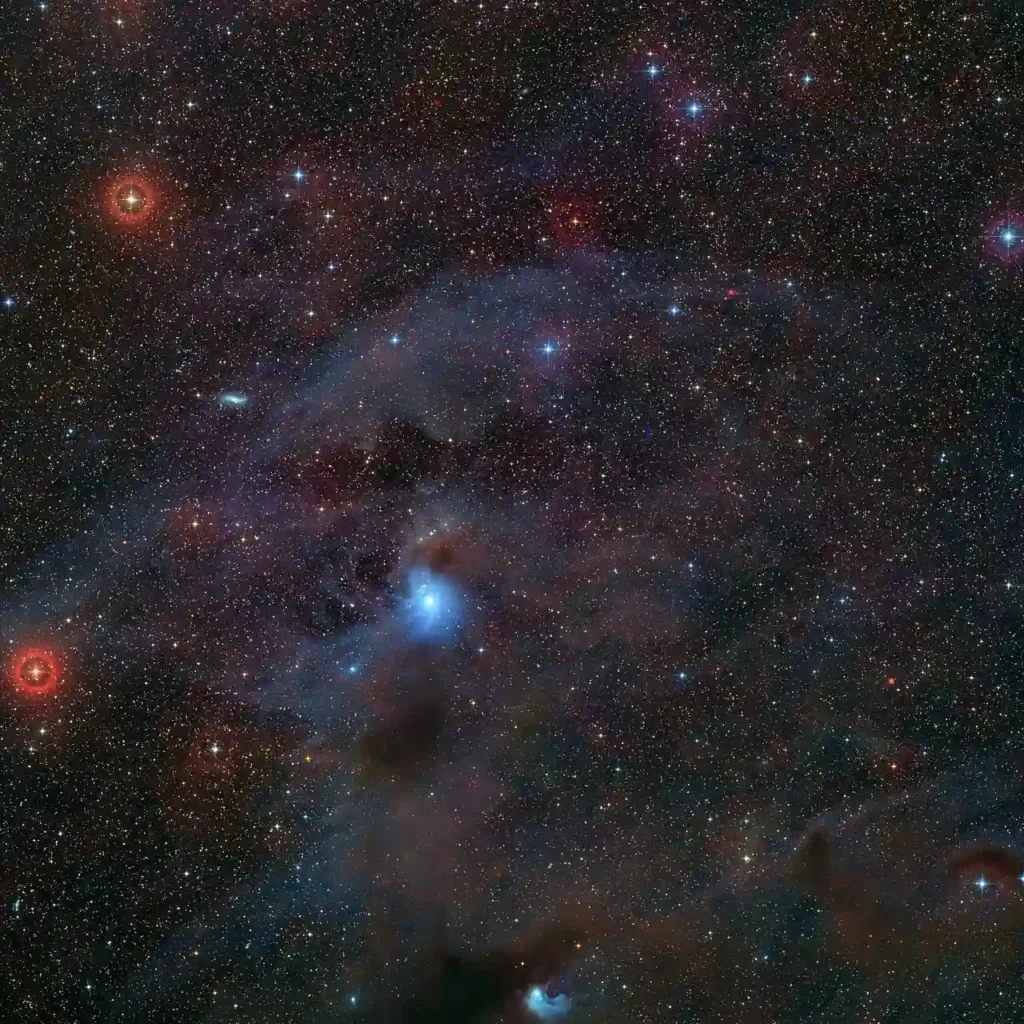
The newly studied object, which has a mass five to 10 times the mass of Jupiter, is located about 620 light-years away in the constellation Chamaeleon. Officially named Cha 1107-7626, this rogue planet is still forming and is fed by a surrounding disc of gas and dust. This material constantly falls onto the free-floating planet, a process known as accretion. However, the team led by Almendros-Abad has now found that the rate at which the young planet is accreting is not steady.

Credit: ESO/Meingast et al.
By August 2025, the planet was accreting about eight times faster than just a few months before, at a rate of six billion tonnes per second!
“This is the strongest accretion episode ever recorded for a planetary-mass object,”
says Almendros-Abad. The discovery, published today in The Astrophysical Journal Letters, was made with the X-shooter spectrograph on ESO’s VLT, located in Chile’s Atacama Desert. The team also used data from the James Webb Space Telescope, operated by the US, European and Canadian space agencies, and archival data from the SINFONI spectrograph on ESO’s VLT.
“The origin of rogue planets remains an open question: are they the lowest-mass objects formed like stars, or giant planets ejected from their birth systems?”
asks co-author Aleks Scholz, an astronomer at the University of St Andrews, United Kingdom. The findings indicate that at least some rogue planets may share a similar formation path to stars since similar bursts of accretion have been spotted in young stars before. As co-author Belinda Damian, also an astronomer at the University of St Andrews, explains:
“This discovery blurs the line between stars and planets and gives us a sneak peek into the earliest formation periods of rogue planets.”
By comparing the light emitted before and during the burst, astronomers gathered clues about the nature of the accretion process. Remarkably, magnetic activity appears to have played a role in driving the dramatic infall of mass, something that has only been observed in stars before. This suggests that even low-mass objects can possess strong magnetic fields capable of powering such accretion events. The team also found that the chemistry of the disc around the planet changed during the accretion episode, with water vapour being detected during it but not before. This phenomenon had been spotted in stars but never in a planet of any kind.
Credit: ESO/ Digitized Sky Survey 2
Free-floating planets are difficult to detect, as they are very faint, but ESO’s upcoming Extremely Large Telescope (ELT), operating under the world’s darkest skies for astronomy, could change that. Its powerful instruments and giant main mirror will enable astronomers to uncover and study more of these lonely planets, helping them to better understand how star-like they are. As co-author and ESO astronomer Amelia Bayo puts it:
“The idea that a planetary object can behave like a star is awe-inspiring and invites us to wonder what worlds beyond our own could be like during their nascent stages.”
More information
This research was presented in a paper titled “Discovery of an Accretion Burst in a Free-Floating Planetary-Mass Object” to appear in The Astrophysical Journal Letters (doi:10.3847/2041-8213/ae09a8).
The team is composed of V. Almendros-Abad (Istituto Nazionale di Astrofisica – Osservatorio Astronomico di Palermo, Italy), Aleks Scholz (School of Physics & Astronomy, University of St Andrews, United Kingdom [St Andrews]), Belinda Damian (St Andrews), Ray Jayawardhana (Department of Physics & Astronomy, Johns Hopkins University, USA [JHU]), Amelia Bayo (European Southern Observatory, Germany), Laura Flagg (JHU), Koraljka Mužić (Instituto de Astrofísica e Ciências do Espaço, Faculdade de Ciências, Universidade de Lisboa, Portugal), Antonella Natta (School of Cosmic Physics, Dublin Institute for Advanced Studies and University College Dublin, Ireland) Paola Pinilla (Mullard Space Science Laboratory, University College London, UK) and Leonardo Testi (Dipartimento di Fisica e Astronomia, Università di Bologna, Italy).
Bibliographic information:
Victor Almendros-Abad et al., 2025 ApJL 992 L2, DOI: 10.3847/2041-8213/ae09a8
Press release from ESO.