Webb studies moon-forming disc around massive planet CT Cha B
The disc offers insight into how the moons of solar system gas giants like Jupiter might have formed.
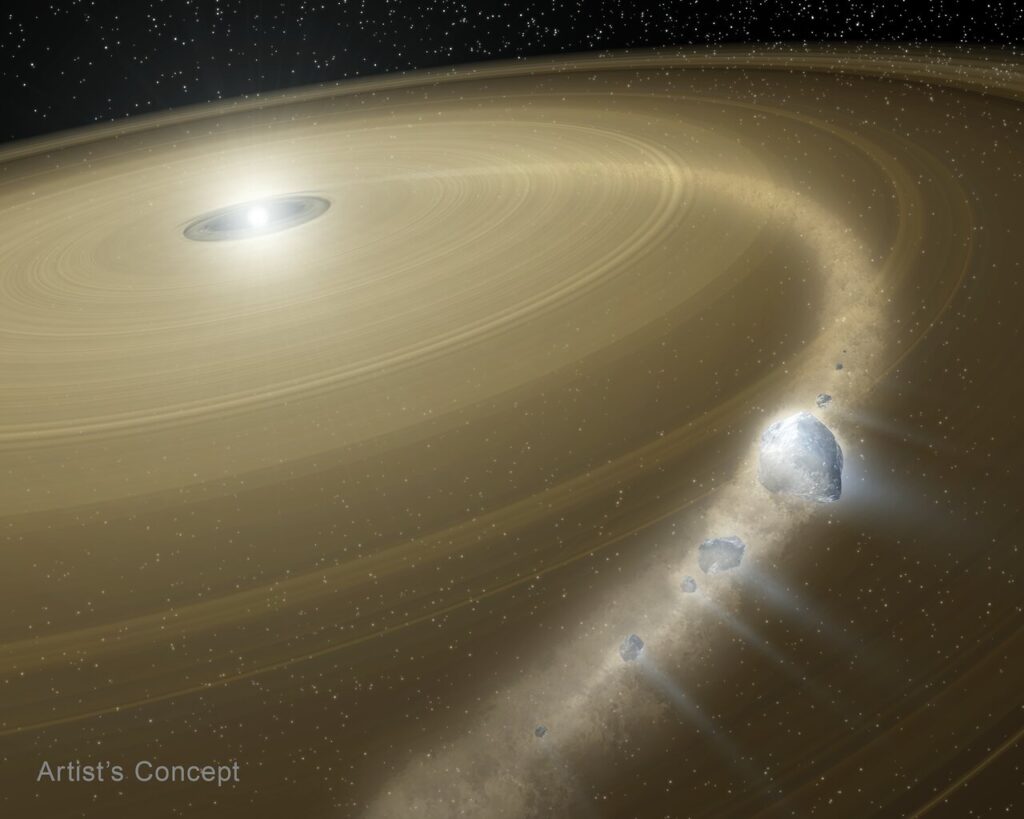
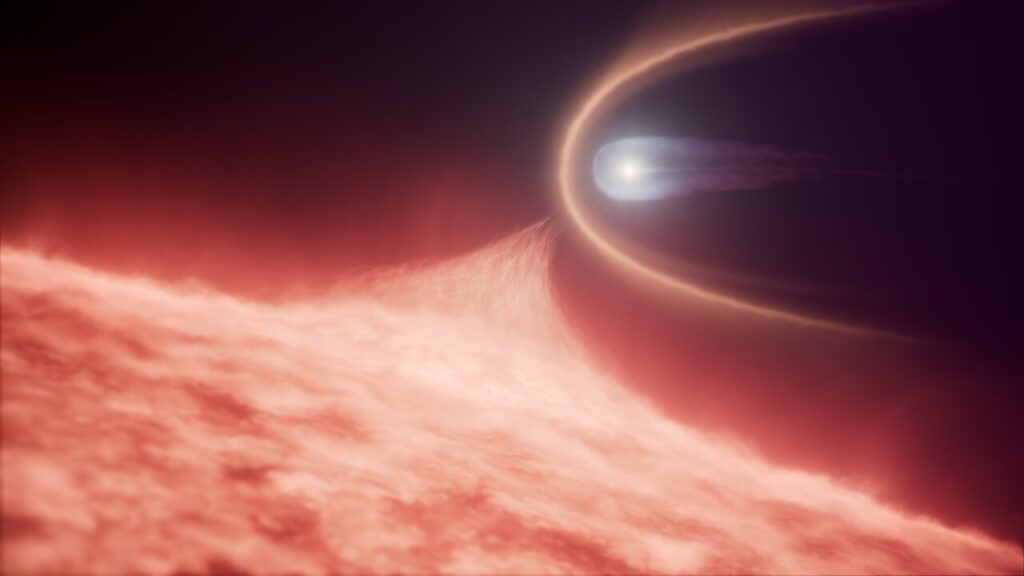
The NASA/ESA/CSA James Webb Space Telescope has provided the first direct measurements of the chemical and physical properties of a potential moon-forming disc encircling a large exoplanet. The carbon-rich disc surrounding the world called CT Cha B, which is located 625 light years away from Earth, is a possible construction yard for moons, although no moons are detected in the Webb data.
Our Solar System contains eight major planets, and more than 400 known moons orbiting six of these planets. Where did they all come from? There are multiple formation mechanisms. The case for large moons, like the four Galilean satellites around Jupiter, is that they condensed out of a dust and gas disc encircling the planet when it formed. But that would have happened over 4 billion years ago, and there is scant forensic evidence today.
Webb has now provided the first direct view of material in a disc around a large exoplanet. An international team of astronomers have uncovered a carbon-rich disc encircling the world called CT Cha b, which is located 625 light-years away from Earth.
The young star the planet orbits is only 2 million years old and still accreting circumstellar material. However, the circumplanetary disc discovered by Webb is not part of the larger accretion disc around the central star. The two objects are 74 billion kilometres apart.
Observing planet and moon formation is fundamental to understanding the evolution of planetary systems across our galaxy. Moons likely outnumber planets, and some might be habitats for life as we know it. But we are now only entering an era where we can witness their formation.
This discovery fosters a better understanding of planet and moon formation, say researchers. Webb’s data is invaluable for making comparisons to our Solar System’s birth over 4 billion years ago.
“We can see evidence of the disc around the companion, and we can study the chemistry for the first time. We’re not just witnessing moon formation – we’re also witnessing this planet’s formation,” said co-lead author Sierra Grant of the Carnegie Institution for Science in Washington, D.C., USA.
“We are seeing what material is accreting to build the planet and moons,” added main lead author Gabriele Cugno of the University of Zurich in Switzerland and member of the National Centre of Competence in Research PlanetS.
Dissecting starlight
Infrared observations of CT Cha b were made with Webb’s MIRI (Mid-Infrared Instrument) using its medium resolution spectrograph. An initial look into Webb’s archival data revealed signs of molecules within the circumplanetary disc, which motivated a deeper dive into the data. Because the planet’s faint signal is buried in the glare of the host star, the researchers had to disentangle the light of the star from the planet using high-contrast methods.
“We saw molecules at the location of the planet, and so we knew that there was stuff in there worth digging for and spending a year trying to tease out of the data. It really took a lot of perseverance,” said Grant.
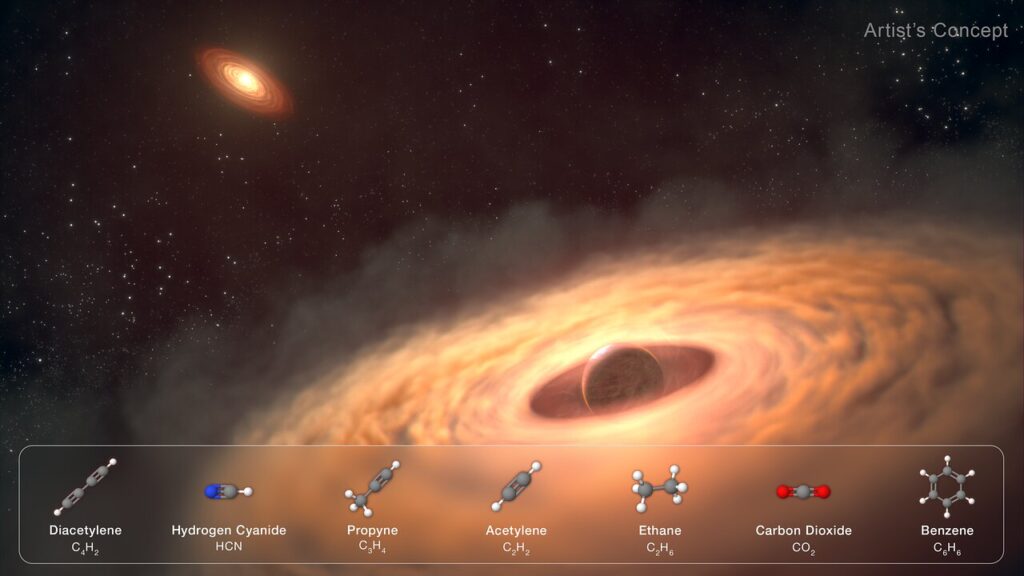
Ultimately, the team discovered seven carbon-bearing molecules within the planet’s disc, including acetylene (C2H2) and benzene (C6H6). This carbon-rich chemistry is in stark contrast to the chemistry seen in the disc around the host star, where the researchers found water but no carbon. The difference between the two discs offers evidence for their rapid chemical evolution over only 2 million years.
Genesis of moons
A circumplanetary disc of debris has long been hypothesized as the birthplace of Jupiter’s four major moons. These Galilean satellites must have condensed out of such a flattened disc billions of years ago, as evident in their co-planar orbits about Jupiter. The two outermost Galilean moons, Ganymede and Callisto, are 50% water ice. But they presumably have rocky cores, perhaps made of carbon or silicon.
“We want to learn more about how our Solar System formed moons. This means that we need to look at other systems that are still under construction. We’re trying to understand how it all works,” said Cugno. “How do these moons come to be? What are the ingredients? What physical processes are at play, and over what timescales? Webb allows us to witness the drama of moon formation and investigate these questions observationally for the first time.”
In the coming year, the team will use Webb to perform a comprehensive survey of similar objects to better understand the diversity of physical and chemical properties in the discs around young planets.
Credit: NASA, ESA, CSA, STScI, G. Cugno (University of Zürich, NCCR PlanetS), S. Grant (Carnegie Institution for Science), J, Olmsted (STScI), L. Hustak (STScI)
Bibliographic information:
Gabriele Cugno and Sierra L. Grant 2025, ApJL 991 L46, DOI: 10.3847/2041-8213/ae0290
Press release from ESA Webb.
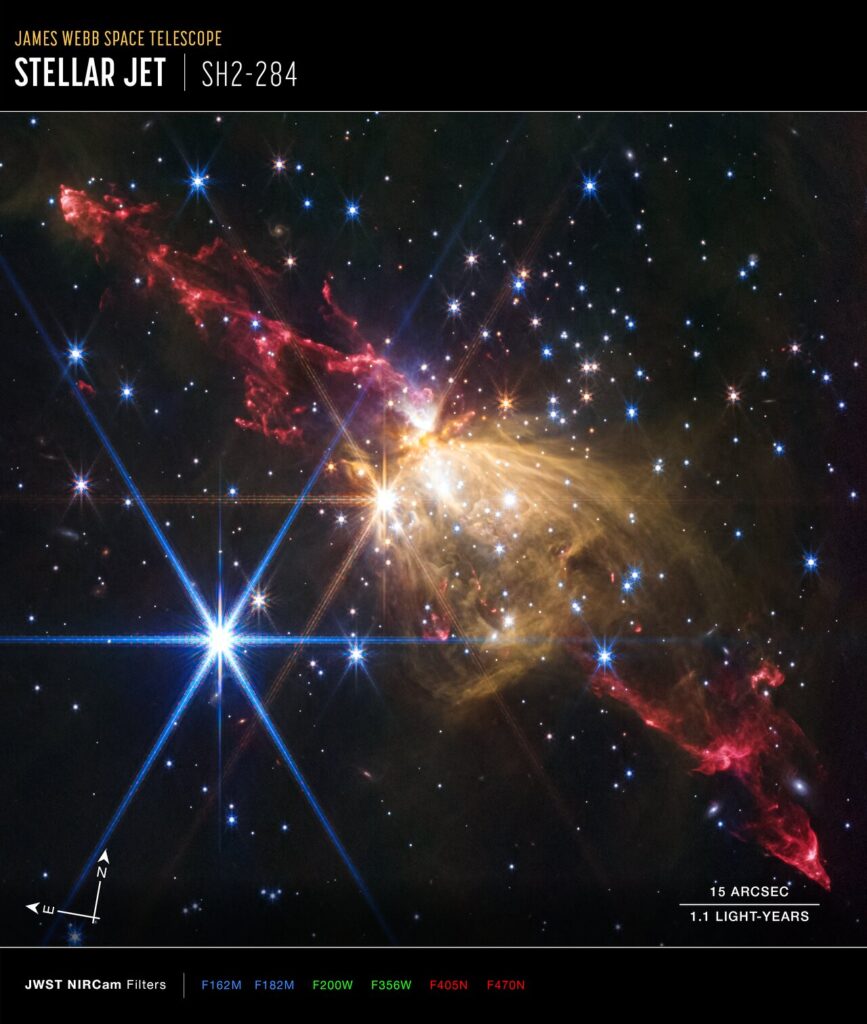
 molecular cloud, the largest star-forming cloud in the Milky Way")