The Start of EPIQUE: developing the European photonic quantum computer
A European €10 million project led by the Sapienza University of Rome with 18 partners
(01/17/24) – To pave the way for a European quantum computer based on photons, the quanta of light: this is the challenge of EPIQUE, the research project funded with €10,340,000 by the European Commission and carried out by 18 partners from 12 countries and led by the Sapienza University of Rome, which starts today with the kick-off meeting.
Quantum computers are one of the most promising technologies of the future, devices potentially capable of solving problems that are impossible even for the most powerful super computers, but they are still at the prototype stage and there are several possible paths of development. One of the most promising is light-based: the use of photons as qubits. EPIQUE – European Photonic Quantum Computer – was set up in order to investigate in depth the potential offered by the development of photonic quantum computing platforms, a project that aims to lead the way in a domain with wide margins for development.
Prototypes of quantum computers based on photonic technologies have demonstrated important advantages in recent years, in particular having a low decoherence of qubits that minimises the loss of information, a simple infrastructure that does not have to operate at near-zero temperatures as in superconducting processors, and a natural integration with fibre-optic communication systems for networking. As many as three of the four demonstrations to date released of quantum advantage – meaning the ability to perform a calculation process that is effectively impossible for a conventional computer – have been achieved using photonic technologies.
However, existing results have often been limited by bulky and difficult-to-scale devices. Recognising the potential of this technological path, EPIQUE now aims to bring together the many European players, both academia and SMEs, already among the world leaders in various fields of photonic technologies, to realise a general-purpose photonic quantum platform. EPIQUE aims to develop three different demonstration prototypes of photonic quantum computers at tens of qubits and to pave the way towards a more ambitious quantum platform of over 1,000 qubits.
“EPIQUE’s work is poised to set a new European standard in photonic quantum computing research”, said Prof. Fabio Sciarrino from Sapienza University of Rome, the EPIQUE Coordinator. “By integrating advancements in both technology and algorithms – added Sciarrino – we are focused on developing a viable trajectory towards an innovative quantum computing platform. The impact of the developed technologies can also affect other application areas of quantum technologies, such as quantum sensing and metrology”
EPIQUE is one of six projects, based on the same number of technological solutions, designed to physically develop a European quantum computer as part of the Quantum Flagship promoted by the European Commission in 2018 and funded with around EUR 1 billion.
The EPIQUE partners are:
– Sapienza Universitàdi Roma (Uniroma1) Italy
– Consiglio Nazionale delle Ricerche (CNR) Italy
– Università degli Studi di Firenze (Unifi) Italy
– Centre National de la Recherche Scientifique (CNRS) France
– Commissariat a l’Energie Atomique et aux Energies Alternatives (CEA) France
– Laboratorio Iberico Internacional de Nanotecnologia Lin (INL) Portugal
– Naukowa I Akademicka Siec Komputerowa – Panstwowy Instytut (NASK) Poland
– Ceske Vysoke Uceni Technicke V Praze (CVUT) Czechia
– Tyndall, University College Cork – National University of Ireland, Cork (UCC) Ireland
– Interuniversitair Micro-Electronica Centrum (IMEC) Belgium
More informations at https://cordis.europa.eu/project/id/101135288
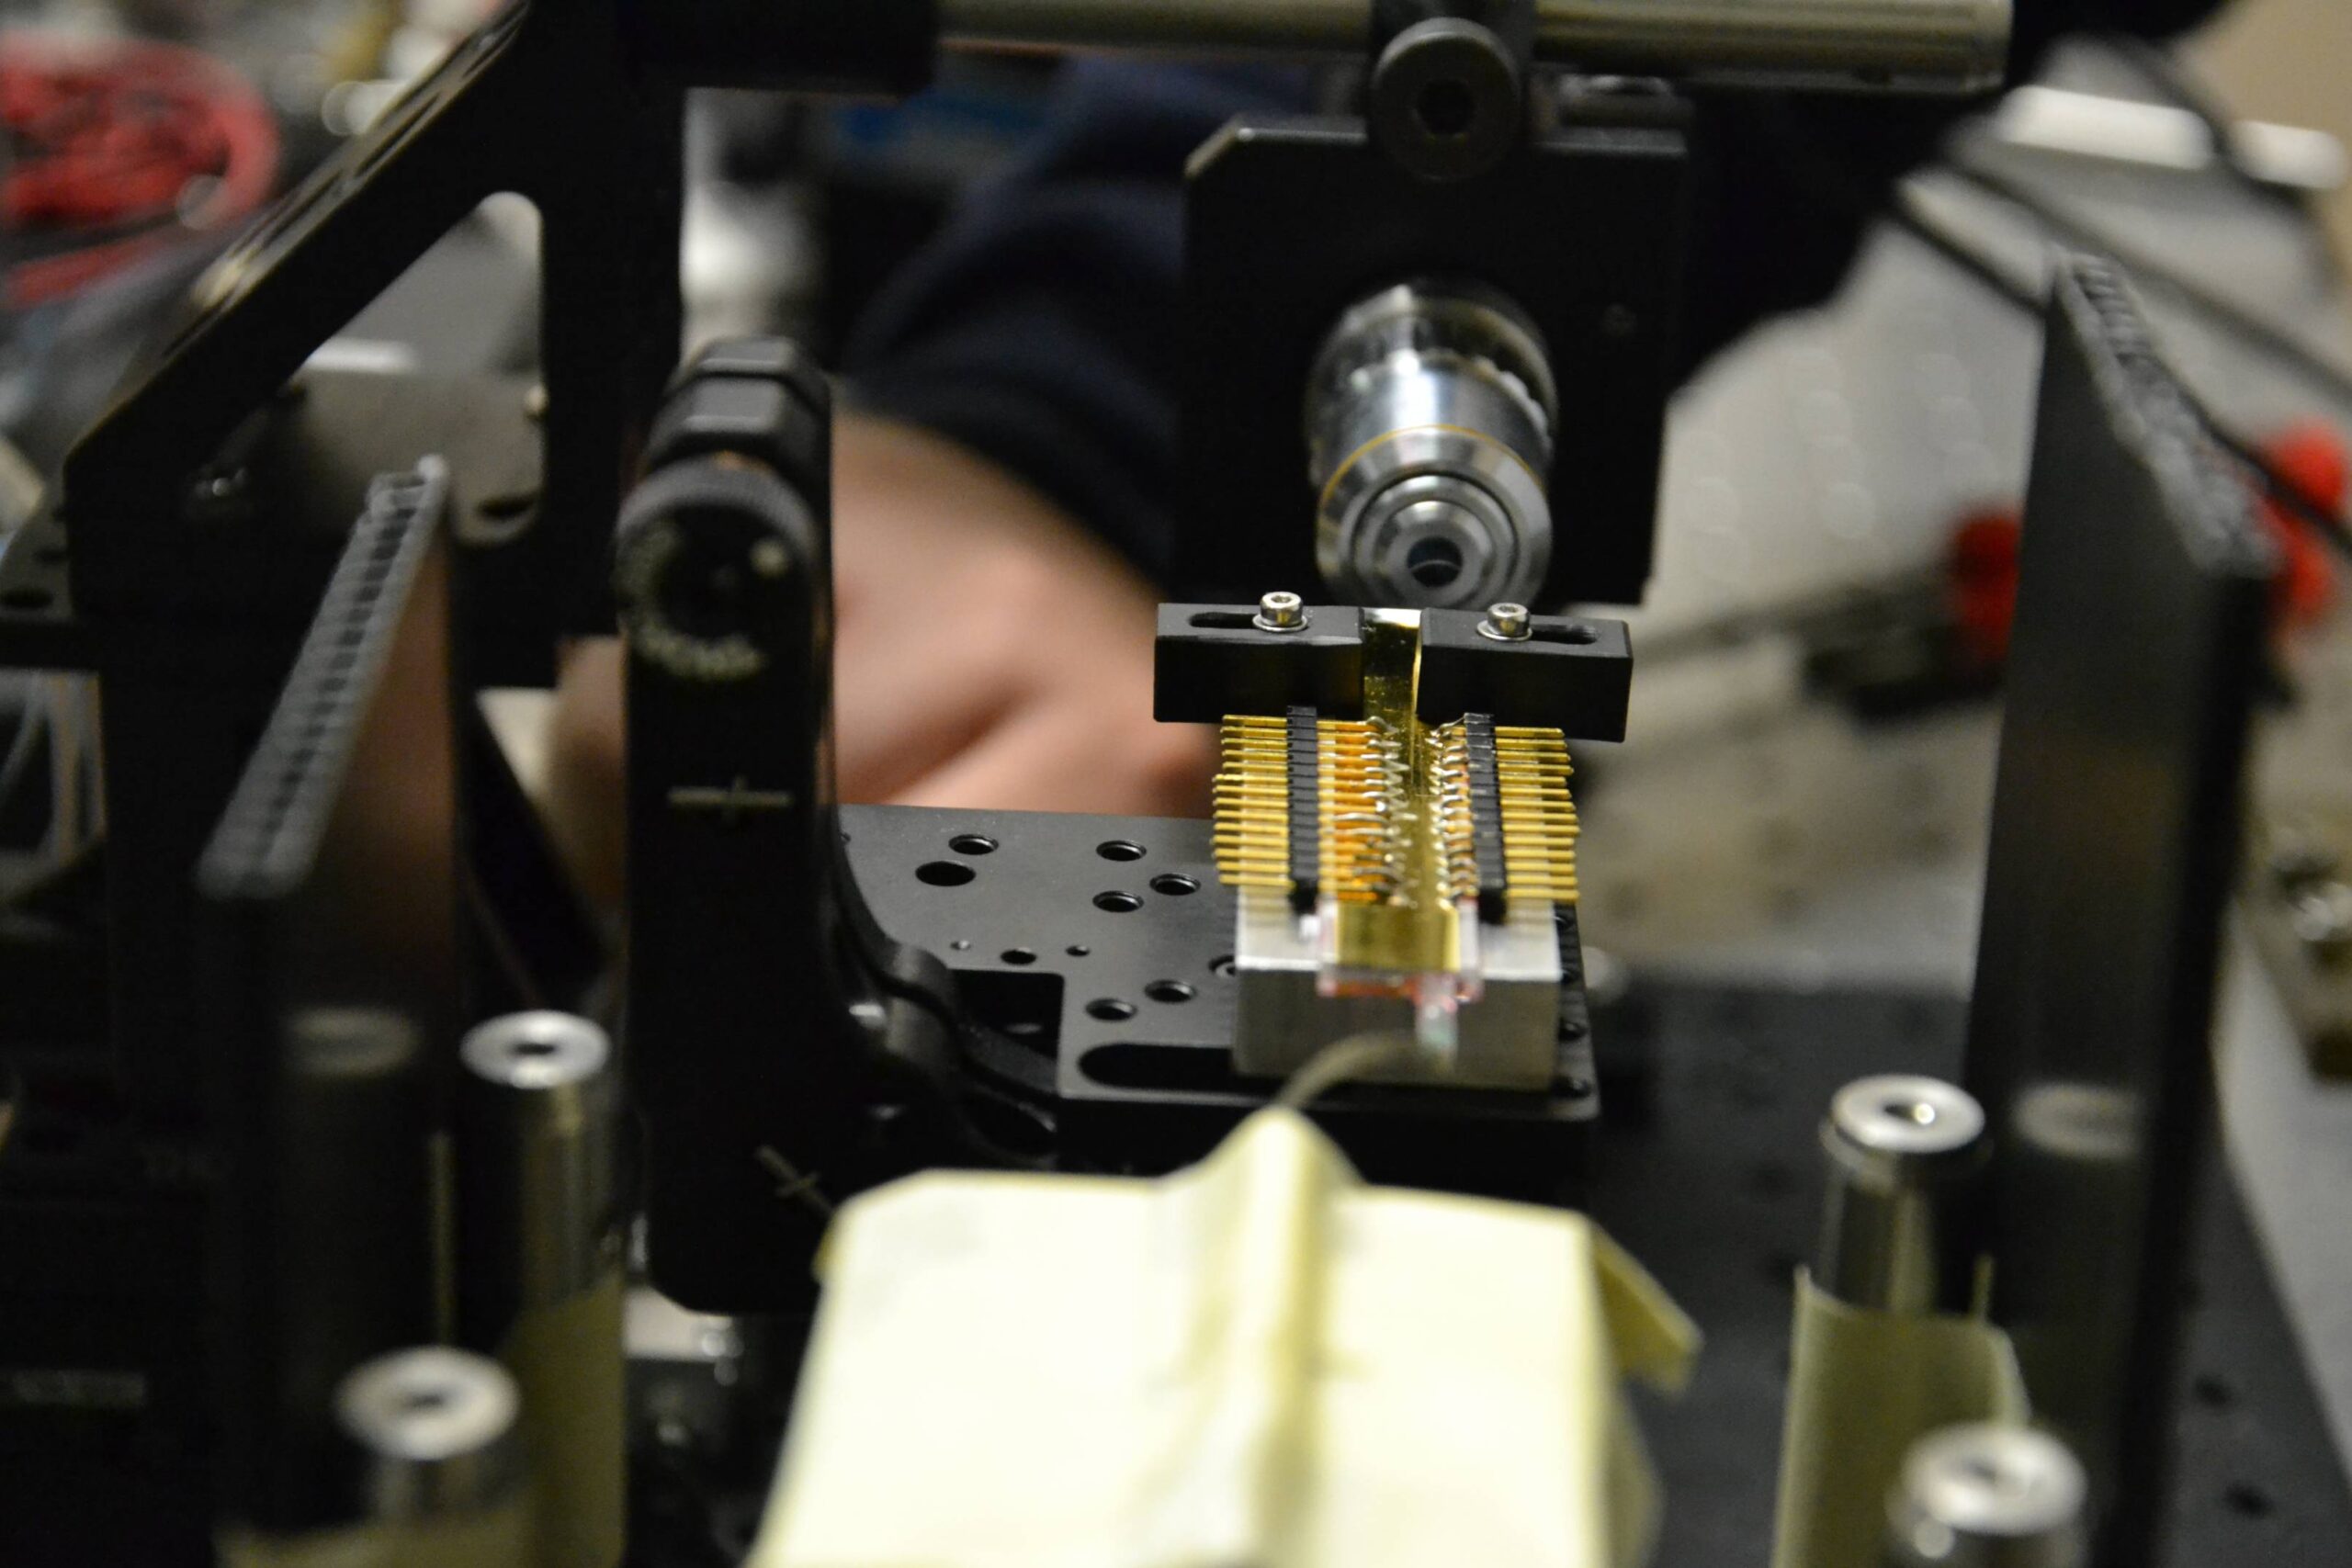
Universal and reprogrammable photonic chip that operates on 8 modes, i.e. 8 waveguides that interact via a network of integrated beamsplitters. Credits: photo by Quantum Lab Sapienza. All rights reserved
Universal and reprogrammable photonic chip that operates on 6 modes, i.e. 6 waveguides that interact via a network of integrated beamsplitters. In the photo the device and the control electronics. Credits: photo by Quantum Lab Sapienza. All rights reserved
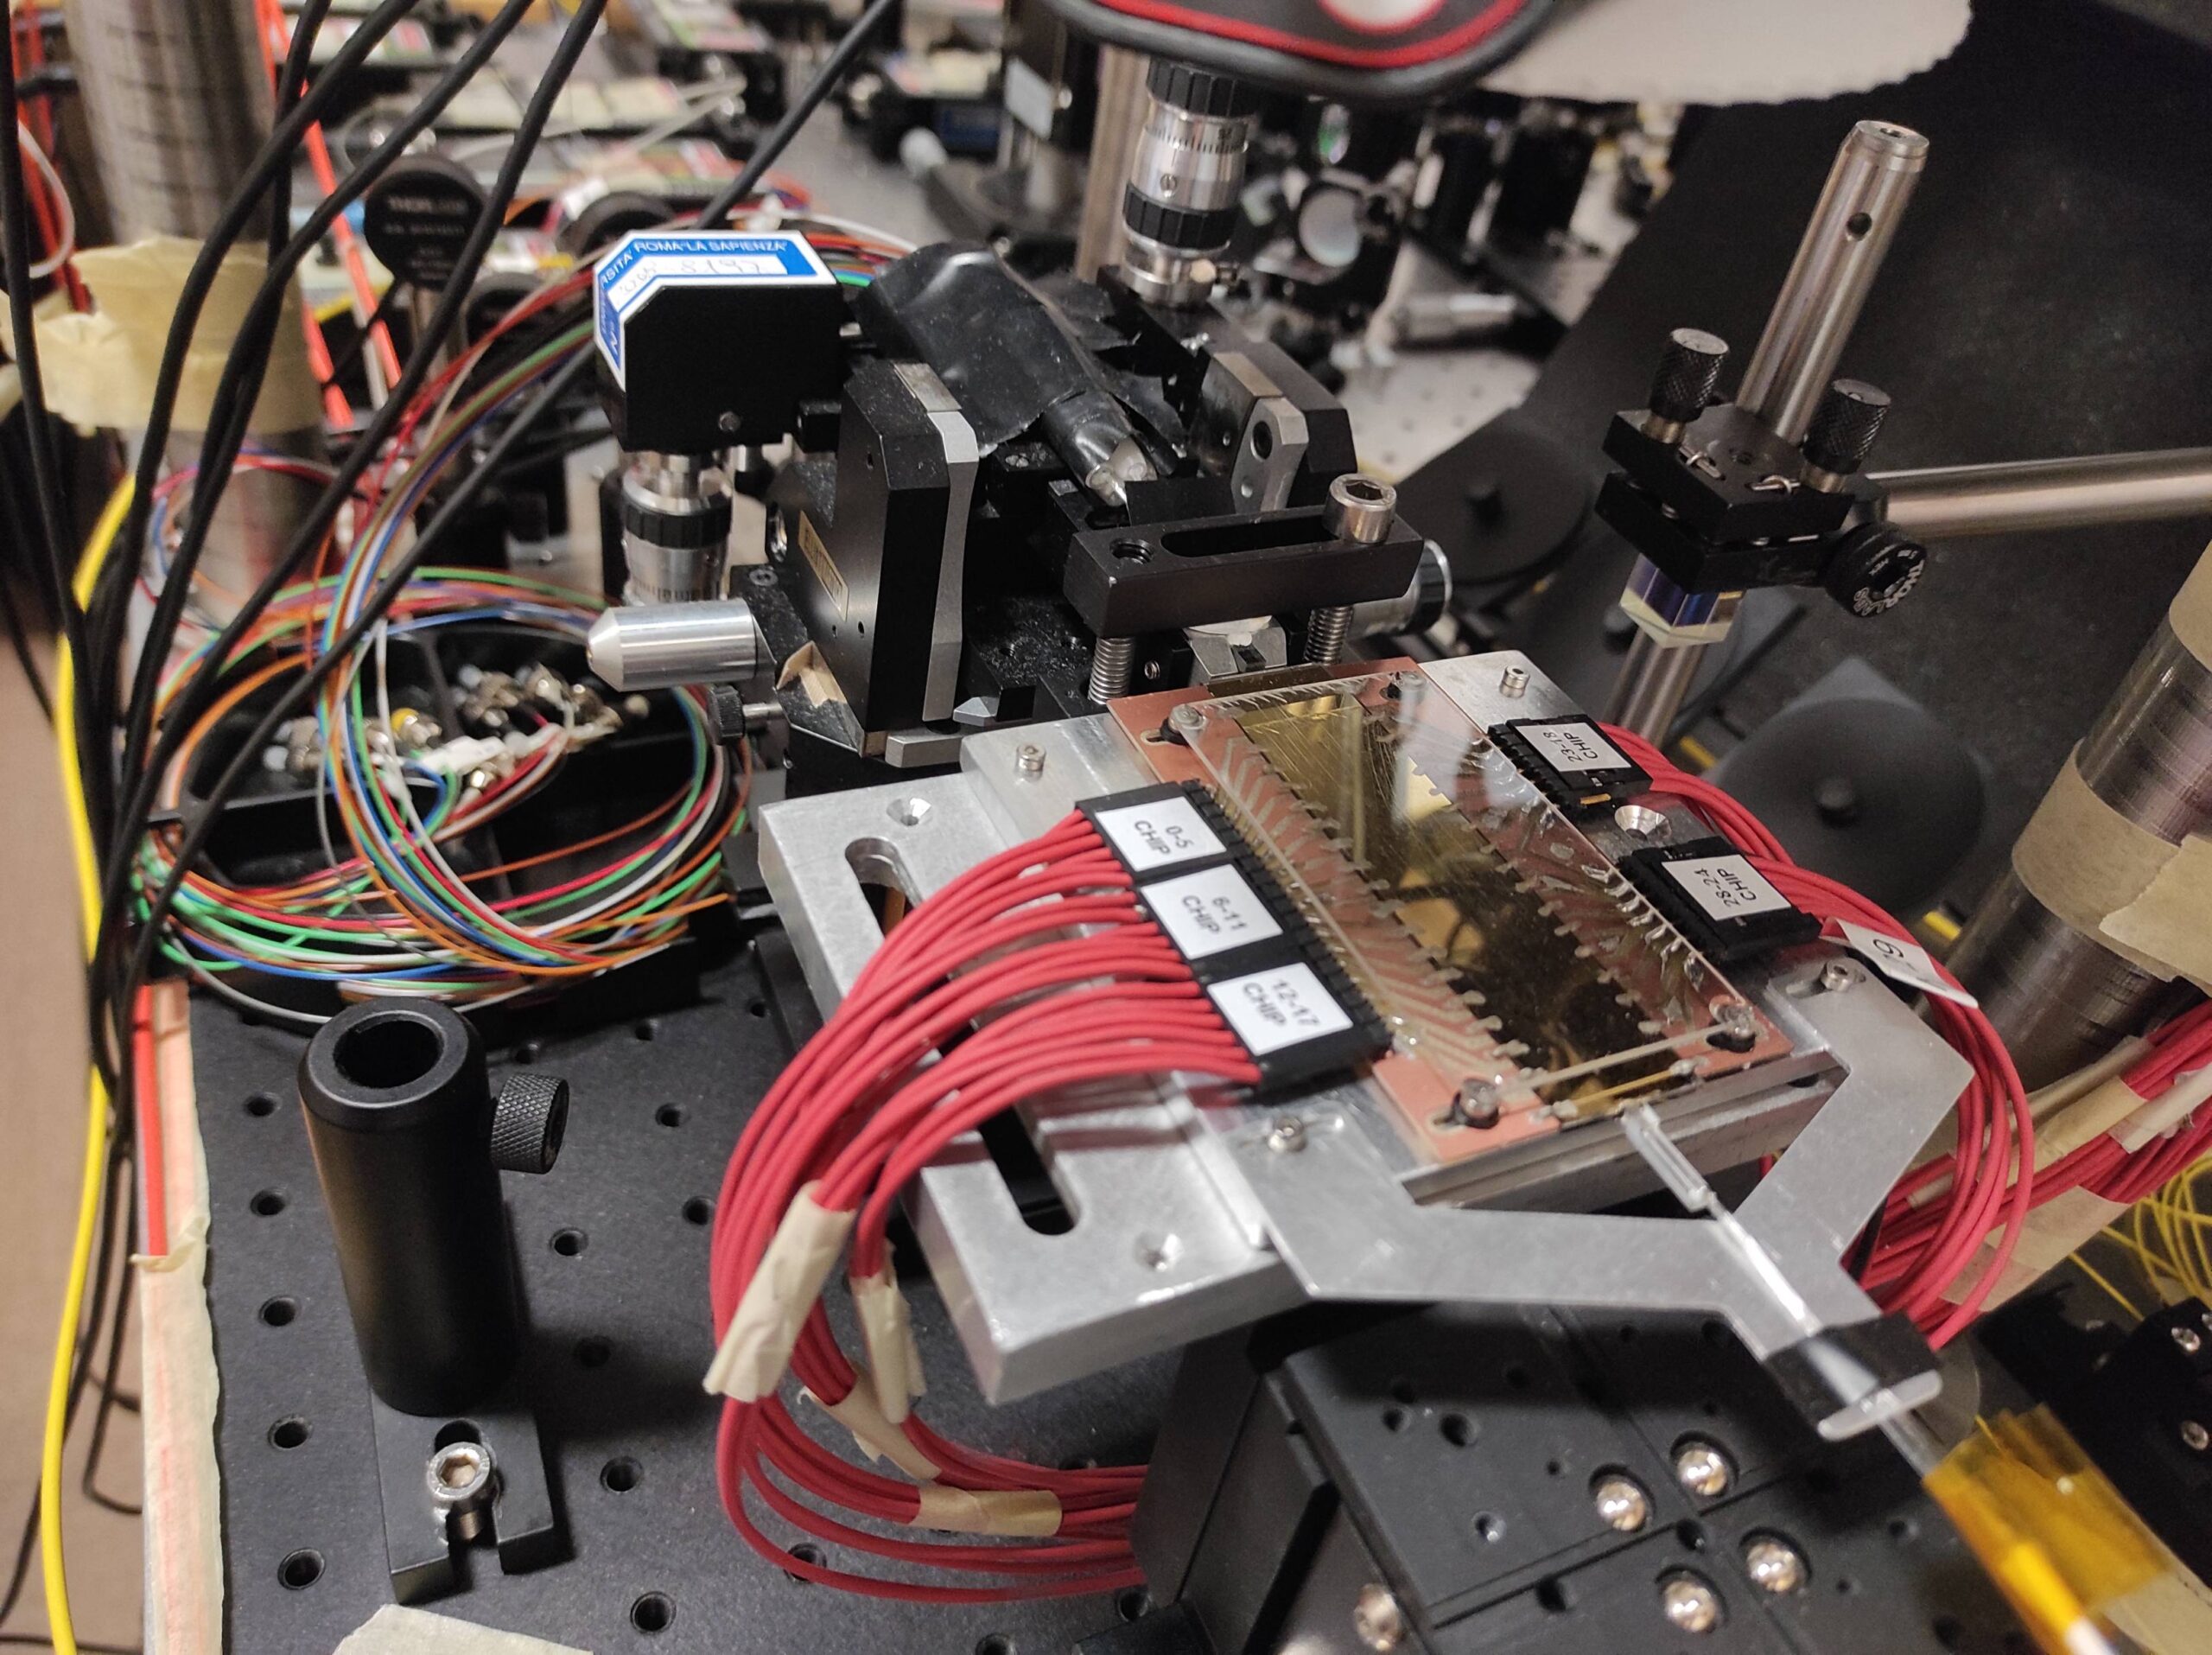
Reprogrammable photonic chip that operates on 32 modes, i.e. 32 waveguides arranged in a triangular lattice that interact continuously inside the device. Credits: photo by Quantum Lab Sapienza. All rights reserved
Schematic illustration of a reconfigurable integrated optical circuit. Credits: figure designed by Quantum Lab Sapienza. All rights reserved
Schematic illustration of a single photo source based on quantum dot technology. Credits: figure designed by Quantum Lab Sapienza. All rights reserved
Schematic illustration of a superconducting nanowire single-photon detector. Credits: figure designed by Quantum Lab Sapienza. All rights reserved
Schematic illustration of an integrated quantum light source based on waveguides made of non-linear materials. Credits: figure designed by Quantum Lab Sapienza. All rights reserved
Schematic view of the internal waveguide structure of an integrated photonic circuit. Credits: figure designed by Quantum Lab Sapienza. All rights reserved
Webb discovers dusty cat’s tail in Beta Pictoris System
Beta Pictoris, a young planetary system located just 63 light-years away, continues to intrigue scientists even after decades of in-depth study. It possesses the first dust disc imaged around another star — a disc of debris produced by collisions between asteroids, comets, and planetesimals. Observations from the NASA/ESA Hubble Space Telescope revealed a second debris disc in this system [1], inclined with respect to the first. Now, a team of astronomers using the NASA/ESA/CSA James Webb Space Telescope to image the Beta Pictoris (Beta Pic) system has discovered a new, previously unseen structure.
This image from Webb’s MIRI (Mid-Infrared Instrument) shows the star system Beta Pictoris. An edge-on disc of dusty debris generated by collisions between planetesimals (orange) dominates the view. A hotter, secondary disc (cyan) is inclined by about 5 degrees relative to the primary disc. The curved feature at upper right, which the science team nicknamed the “cat’s tail,” has never been seen before. A coronagraph (black circle and bar) has been used to block the light of the central star, whose location is marked with a white star shape. In this image light at 15.5 microns is coloured cyan and 23 microns is orange (filters F1550C and F2300C, respectively). Credit: NASA, ESA, CSA, STScI, C. Stark and K. Lawson (NASA GSFC), J. Kammerer (ESO), and M. Perrin (STScI)
The team, led by Isabel Rebollido of the Astrobiology Center in Spain, and now an ESA Research Fellow, used Webb’s NIRCam (Near-Infrared Camera) and MIRI (Mid-Infrared Instrument) to investigate the composition of Beta Pic’s previously detected main and secondary debris discs. The results exceeded their expectations, revealing a sharply inclined branch of dust, shaped like a cat’s tail, that extends from the southwest portion of the secondary debris disc.
“Beta Pictoris is the debris disc that has it all: It has a really bright, close star that we can study very well,” said Rebollido. “While there have been previous observations from the ground in this wavelength range, they did not have the sensitivity and the spatial resolution that we now have with Webb, so they didn’t detect this feature.”
This image from Webb’s MIRI (Mid-Infrared Instrument) shows the star system Beta Pictoris. An edge-on disc of dusty debris generated by collisions between planetesimals (orange) dominates the view. A hotter, secondary disc (cyan) is inclined by about 5 degrees relative to the primary disc. The curved feature at upper right, which the science team nicknamed the “cat’s tail,” has never been seen before. A coronagraph (black circle and bar) has been used to block the light of the central star, whose location is marked with a white star shape. In this image light at 15.5 microns is coloured cyan and 23 microns is orange (filters F1550C and F2300C, respectively). Credit: NASA, ESA, CSA, STScI, C. Stark and K. Lawson (NASA GSFC), J. Kammerer (ESO), and M. Perrin (STScI)
A Star’s Portrait Improved with Webb
Even with Webb, peering at Beta Pic in the right wavelength range — in this case, the mid-infrared — was crucial to detect the cat’s tail, as it only appeared in the MIRI data. Webb’s mid-infrared data also revealed differences in temperature between Beta Pic’s two discs, which likely is due to differences in composition.
“We didn’t expect Webb to reveal that there are two different types of material around Beta Pic, but MIRI clearly showed us that the material of the secondary disc and cat’s tail is hotter than the main disc,” said Christopher Stark, a co-author of the study at NASA’s Goddard Space Flight Center in Greenbelt, Maryland. “The dust that forms that disc and tail must be very dark, so we don’t easily see it at visible or near-infrared wavelengths — but in the mid-infrared, it’s glowing.”
To explain the hotter temperature, the team deduced that the dust may be highly porous “organic refractory material,” similar to the matter found on the surfaces of comets and asteroids in our solar system. For example, a preliminary analysis of material sampled from asteroid Bennu by NASA’s OSIRIS-Rex mission found it to be very dark and carbon-rich, much like what MIRI detected at Beta Pic.
The Tail’s Puzzling Beginning Warrants Future Research
However, a major lingering question remains: What could explain the shape of the cat’s tail, a uniquely curved feature unlike what is seen in discs around other stars?
Rebollido and the team modelled various scenarios in an attempt to emulate the cat’s tail and unravel its origins. Though further research and testing is required, the team presents a strong hypothesis that the cat’s tail is the result of a dust production event that occurred a mere one hundred years ago.
“Something happens — like a collision — and a lot of dust is produced,” shared Marshall Perrin, a co-author of the study at the Space Telescope Science Institute in Baltimore, Maryland. “At first, the dust goes in the same orbital direction as its source, but then it also starts to spread out. The light from the star pushes the smallest, fluffiest dust particles away from the star faster, while the bigger grains do not move as much, creating a long tendril of dust.”
“The cat’s tail feature is highly unusual, and reproducing the curvature with a dynamical model was difficult,” explained Stark. “Our model requires dust that can be pushed out of the system extremely rapidly, which again suggests it’s made of organic refractory material.”
The team’s preferred model explains the sharp angle of the tail away from the disc as a simple optical illusion. Our perspective combined with the curved shape of the tail creates the observed angle of the tail, while in fact, the arc of material is only departing from the disc at a five-degree incline. Taking into consideration the tail’s brightness, the team estimates the amount of dust within the cat’s tail to be equivalent to a large main belt asteroid spread out across 16 billion kilometres.
A recent dust production event within Beta Pic’s debris discs could also explain an asymmetry previously spotted by the Atacama Large Millimeter/submillimeter Array in 2014: a clump of carbon monoxide (CO) located near the cat’s tail. Since the star’s radiation should break down CO within roughly one hundred years, this still-present concentration of gas could be lingering evidence of the same event.
“Our research suggests that Beta Pic may be even more active and chaotic than we had previously thought,” said Stark. “Webb continues to surprise us, even when looking at the most well-studied objects. We have a completely new window into these planetary systems.”
These results were presented in a press conference at the 243rd meeting of the American Astronomical Society in New Orleans, Louisiana.
The observations were taken as part of Guaranteed Time Observation program 1411.
Notes
[1] Learn more about these 2006 Hubble observations that revealed a second debris disc in the Beta Pic system here.
This image from Webb’s MIRI (Mid-Infrared Instrument) shows the star system Beta Pictoris. An edge-on disc of dusty debris generated by collisions between planetesimals (orange) dominates the view. A hotter, secondary disc (cyan) is inclined by about 5 degrees relative to the primary disc. The curved feature at upper right, which the science team nicknamed the “cat’s tail,” has never been seen before. A coronagraph (black circle and bar) has been used to block the light of the central star, whose location is marked with a white star shape. In this image light at 15.5 microns is coloured cyan and 23 microns is orange (filters F1550C and F2300C, respectively). Credit: NASA, ESA, CSA, STScI, C. Stark and K. Lawson (NASA GSFC), J. Kammerer (ESO), and M. Perrin (STScI)
Hubble finds weird home of farthest fast radio burst, FRB 20220610A
Astronomers using the NASA/ESA Hubble Space Telescope have found a rare oddball event in an oddball place.
A Hubble Space Telescope image of the host galaxy of an exceptionally powerful Fast Radio Burst, FRB20220610A. Hubble’s sensitivity and sharpness reveals a compact group of multiple galaxies that may be in the process of merging. They existed when the Universe was only 5 billion years old. FRB 20220610A was first detected on June 10, 2022 by the Australian Square Kilometre Array Pathfinder (ASKAP) radio telescope in Western Australia, and confirmed to come from a distant origin by the European Southern Observatory’s Very Large Telescope in Chile. Credit: NASA, ESA, STScI, Alexa Gordon (Northwestern University)
A Fast Radio Burst (FRB) is a fleeting blast of energy that can – for a few milliseconds – outshine an entire galaxy. Over the past few years hundreds of FRBs have been detected. They pop off all over the sky like camera flashes at a stadium event, but the sources behind these intense bursts of radiation remain uncertain.
This FRB is particularly weird because it erupted halfway across the Universe, making it the farthest and most powerful one detected to date.
And if that’s not strange enough, it just got weirder based on the follow-up Hubble observations after its discovery. The FRB flashed in what seems like an unlikely place, a collection of galaxies that existed when the Universe was only 5 billion years old. Previous FRBs have been found in isolated galaxies.
A Hubble Space Telescope image of the host galaxy of an exceptionally powerful Fast Radio Burst, FRB20220610A. Hubble’s sensitivity and sharpness reveals a compact group of multiple galaxies that may be in the process of merging. They existed when the Universe was only 5 billion years old. FRB 20220610A was first detected on June 10, 2022 by the Australian Square Kilometre Array Pathfinder (ASKAP) radio telescope in Western Australia, and confirmed to come from a distant origin by the European Southern Observatory’s Very Large Telescope in Chile. Credit: NASA, ESA, STScI, Alexa Gordon (Northwestern University)
FRB 20220610A was first detected on 10 June 2022 by the Australian Square Kilometre Array Pathfinder (ASKAP) radio telescope in Western Australia, and confirmed to come from a distant origin by the European Southern Observatory’s Very Large Telescope in Chile. It is four times more energetic than closer FRBs. This might challenge models of what is producing FRBs. Or could it be a selection effect where only very bright FRBs can be detected halfway across the Universe?
“It required Hubble’s keen sharpness and sensitivity to pinpoint exactly where the FRB came from,” said lead author Alexa Gordon of Northwestern University in Evanston, Illinois. “Without Hubble’s imaging, it would still remain a mystery as to whether this was originating from one monolithic galaxy or from some type of interacting system. It’s these types of environments – these weird ones – that are driving us toward better understanding the mystery of FRBs.”
Hubble’s crisp images suggest there may be as many as seven galaxies on a possible path to merging, which would also be very significant, say researchers. Such groups of galaxies are rare, and it’s possible this led to the conditions that triggered the FRB.
“We are ultimately trying to answer the questions: What causes them? What are their progenitors and what are their origins? The Hubble observations provide a spectacular view of the surprising types of environments that give rise to these mysterious events,” said co-investigator Wen-fai Fong, also of Northwestern University.
Though astronomers do not have a consensus on the possible mechanism behind this extraordinary phenomenon, it’s generally thought that FRBs must involve some sort of compact object, like a black hole or neutron star. One extreme type of neutron star is called a magnetar – the most intensely magnetic type of neutron star in the Universe. It has a magnetic field that is so strong that, if a magnetar were located halfway between Earth and the Moon, it would erase the magnetic strip on everyone’s credit card in the world. Much worse yet, if an astronaut travelled within a few hundred kilometres of the magnetar, they would effectively be dissolved, because every atom in their body would be disrupted.
Possible mechanisms involve some kind of jarring starquake, or alternatively, an explosion caused when a magnetar’s twisting magnetic field lines snap and reconnect. A similar phenomenon happens on the Sun, causing solar flares, but a magnetar’s field is a trillion times stronger than the Sun’s magnetosphere. The snapping would generate an FRB’s flash, or might make a shock wave that incinerates surrounding dust and heats gas into a plasma.
There could be several flavours of magnetars. In one case, it could be an exploding object orbiting a black hole surrounded by a disk of material. Another alternative is a pair of orbiting neutron stars whose magnetospheres periodically interact, creating a cavity where eruptions can take place. It’s estimated that magnetars are active for about 10,000 years before settling down, so they would be expected to be found where a firestorm of star birth is taking place. But this doesn’t seem to be the case for all magnetars.
A Hubble Space Telescope image of the host galaxy of an exceptionally powerful Fast Radio Burst, FRB20220610A. Hubble’s sensitivity and sharpness reveals a compact group of multiple galaxies that may be in the process of merging. They existed when the Universe was only 5 billion years old. FRB 20220610A was first detected on June 10, 2022 by the Australian Square Kilometre Array Pathfinder (ASKAP) radio telescope in Western Australia, and confirmed to come from a distant origin by the European Southern Observatory’s Very Large Telescope in Chile. Credit: NASA, ESA, STScI, Alexa Gordon (Northwestern University)
In the near future, FRB experiments will increase their sensitivity, leading to an unprecedented rate in the number of FRBs detected at these distances. Hubble will play a crucial role in characterising the environments in which these FRBs occur. Astronomers will soon learn just how special the environment of this FRB was.
“We just need to keep finding more of these FRBs, both nearby and far away, and in all these different types of environments,” said Gordon.
Hubble observes a changing exoplanet atmosphere at WASP-121 b
This is an artist’s impression of the exoplanet WASP 121-b, also known as Tylos. The exoplanet’s appearance is based on Hubble data of the object. Using Hubble observations, another team of scientists had previously reported the detection of heavy metals such as magnesium and iron escaping from the upper atmosphere of the ultra-hot Jupiter exoplanet, marking it as the first of such detection. The exoplanet is orbiting dangerously close to its host star, roughly 2.6% of the distance between Earth and the Sun, placing it on the verge of being ripped apart by its host star’s tidal forces. The powerful gravitational forces have altered the planet’s shape. An international team of astronomers assembled and reprocessed Hubble observations of the exoplanet made in the years 2016, 2018 and 2019. This provided them with a unique dataset that allowed them not only to analyse the atmosphere of WASP 121-b, but also to compare the state of the exoplanet’s atmosphere across several years. They found clear evidence that the observations of WASP-121 b were varying in time. The team then used sophisticated modelling techniques to demonstrate that these temporal variations could be explained by weather patterns in the exoplanet’s atmosphere. Credit: NASA, ESA, Q. Changeat et al., M. Zamani (ESA/Hubble)
An international team of astronomers has assembled and reprocessed observations of the exoplanet WASP-121 b that were collected with the NASA/ESA Hubble Space Telescope in the years 2016, 2018 and 2019. This provided them with a unique dataset that allowed them not only to analyse the atmosphere of WASP 121 b, but also to compare the state of the exoplanet’s atmosphere across several years. They found clear evidence that the observations of WASP-121 b were varying in time. The team then used sophisticated modelling techniques to demonstrate that these temporal variations could be explained by weather patterns in the exoplanet’s atmosphere.
Observing exoplanets — planets beyond our Solar System — is challenging, because of both their distance from Earth and the fact that they mostly orbit stars that are far bigger and brighter than the planets are. This means that astronomers who have been able to observe an exoplanet with a telescope as sophisticated as Hubble typically have to combine all their data in order to get enough information to make confident deductions about the exoplanet’s properties. By combining the observations to increase the strength of the exoplanet signal, astronomers can construct an averaged picture of its atmosphere, but this does not tell them whether it is changing. In other words, they cannot study the weather on other worlds using this averaging method. Studying weather requires far more data of high quality, taken over a wider period of time. Fortunately, Hubble has now been active for such an impressive length of time that a vast archive of Hubble data exists, sometimes with multiple sets of observations of the same celestial object — and that includes the exoplanet WASP-121 b.
WASP-121 b (also known as Tylos) is a well-studied hot Jupiter [1] that orbits a star that lies about 880 light-years from Earth, completing a full orbit in a very brisk 30-hour period. Its extremely close proximity to its host star means that it is tidally locked [2], and that the star-facing hemisphere is very hot, with temperatures exceeding 3000 Kelvins [3]. The team combined four sets of archival observations of WASP-121 b, all made using Hubble’s Wide Field Camera 3 (WFC 3). The complete assembled dataset included observations of: WASP-121 b transiting in front of its star (taken in June 2016); WASP-121 b transiting behind its star, also known as a secondary eclipse (taken in November 2016); and two phase-curves [4] of WASP-121 b (taken in March 2018 and February 2019 respectively). The team took the unique step of processing each dataset in the same way, even if it had been previously processed by a different team. Exoplanet data processing is time consuming and complicated, but nonetheless it was worth it because it allowed the team to directly compare the processed data from each set of observations with one another. One of the principal investigators of the team, Quentin Changeat, an ESA Research Fellow at the Space Telescope Science Institute, elaborates:
“Our dataset represents a significant amount of observing time for a single planet and is currently the only consistent set of such repeated observations. The information that we extracted from those observations was used to characterise (infer the chemistry, temperature, and clouds) of the atmosphere of WASP-121 b at different times. This provided us with an exquisite picture of the planet, changing in time.”
After cleaning each dataset, the team found clear evidence that the observations of WASP-121 b were varying in time. While instrumental effects could remain, the data showed an apparent shift in the exoplanet’s hot spot [5] and differences in spectral signature (which signifies the chemical composition of the exoplanet’s atmosphere) indicative of a changing atmosphere. Next, the team used highly sophisticated computational models to attempt to understand observed behaviour of the exoplanet’s atmosphere. The models indicated that their results could be explained by quasi-periodic weather patterns, specifically massive cyclones that are repeatedly created and destroyed as a result of the huge temperature difference between the star-facing and dark side of the exoplanet. This result represents a significant step forward in potentially observing weather patterns on exoplanets.
“The high resolution of our exoplanet atmosphere simulations allows us to accurately model the weather on ultra-hot planets like WASP-121 b,” explained Jack Skinner, a postdoctoral fellow at the California Institute of Technology and co-leader of this study. “Here we make a significant step forward by combining observational constraints with atmosphere simulations to understand the time-varying weather on these planets.”
“Weather on Earth is responsible for many aspects of our life, and in fact the long-term stability of Earth’s climate and its weather is likely the reason why life could emerge in the first place,” added Changeat. “Studying exoplanets’ weather is vital to understanding the complexity of exoplanet atmospheres, especially in our search for exoplanets with habitable conditions.”
Future observations with Hubble and other powerful telescopes, including Webb, will provide greater insight into weather patterns on distant worlds: and ultimately, possibly to finding exoplanets with stable long-term climates and weather patterns.
Notes
[1] Hot Jupiters are a type of exoplanet with no direct Solar System analogue: they are inflated gas giants that orbit very close to their parent stars, often performing a complete orbit in a matter of a few days.
[2] Tidal locking refers to the situation where an orbiting body always presents the same hemisphere to the object that it orbits. For example, the Moon is tidally locked to Earth, which explains why the surface of the Moon always looks the same from our perspective here on Earth. In some cases, the two bodies might be tidally locked to one another, although this is not the case for the Moon and Earth: from the perspective of an astronaut on the Moon, Earth still appears to rotate on its own axis. Tidally locked planets will have an extremely uneven temperature distribution across their entire surface, with the star-facing hemisphere much hotter than the other.
[3] Kelvins (K) are the unit of temperature typically used by many scientists, including astronomers. Kelvins are the same in size as degrees Celsius (℃), however, the Kelvin scale is offset from the Celsius scale, which is set to zero at the freezing point of water at one atmosphere of pressure. In contrast, zero on the Kelvin scale is known as absolute zero, and is thought to be the lowest temperature possible, where all kinetic activity of all molecules ceases. 0 K is equivalent to –273.15 ℃.
[4] Exoplanet phase curves show the varying amount of light received from a star-exoplanet system as the exoplanet orbits its parent star.
[5] Exoplanet hot spots are, as the name suggests, the hottest spots on the exoplanet’s surface. Whilst it would be intuitive to suppose that the hotspot will always be at the point on the planet closest to the star, in fact many studies have shown that exoplanet hotspots are frequently offset. This may be due to wind or other atmospheric patterns on the exoplanets themselves.
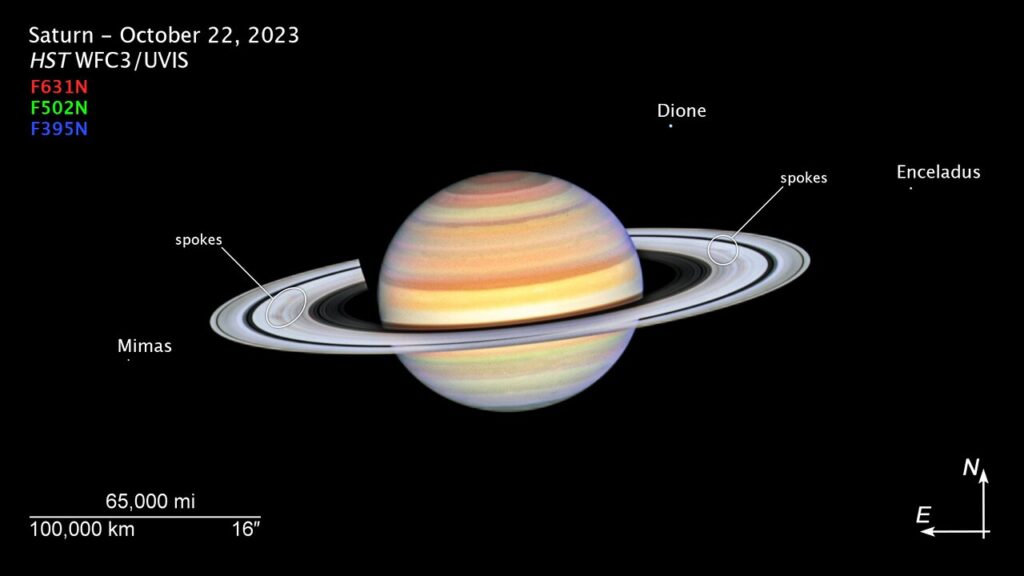
This photo of Saturn was taken by the NASA/ESA Hubble Space Telescope on 22 October 2023, when the ringed planet was approximately 1365 million kilometres from Earth. Hubble’s ultra-sharp vision reveals a phenomenon called ring spokes. Saturn’s spokes are transient features that rotate along with the rings. Their ghostly appearance only persists for two or three rotations around Saturn. During active periods, freshly-formed spokes continuously add to the pattern. In 1981, NASA’s Voyager 2 first photographed the ring spokes. Hubble continues observing Saturn annually as the spokes come and go. This cycle has been captured by Hubble’s Outer Planets Atmospheres Legacy (OPAL) program that began nearly a decade ago to annually monitor weather changes on all four gas-giant outer planets. Hubble’s crisp images show that the frequency of spoke apparitions is seasonally driven, first appearing in OPAL data in 2021 but only on the morning (left) side of the rings. Long-term monitoring shows that both the number and contrast of the spokes vary with Saturn’s seasons. Saturn is tilted on its axis like Earth and has seasons lasting approximately seven years. This year, these ephemeral structures appear on both sides of the planet simultaneously as they spin around the giant world. Although they look small compared with Saturn, their length and width can stretch longer than Earth’s diameter! The OPAL team notes that the leading theory is that spokes are tied to interactions between Saturn’s powerful magnetic field and the sun. Planetary scientists think that electrostatic forces generated from this interaction levitate dust or ice above the ring to form the spokes, though after several decades no theory perfectly predicts the spokes. Continued Hubble observations may eventually help solve the mystery. Credit: Credit: NASA, ESA, STScI, A. Simon (NASA-GSFC)
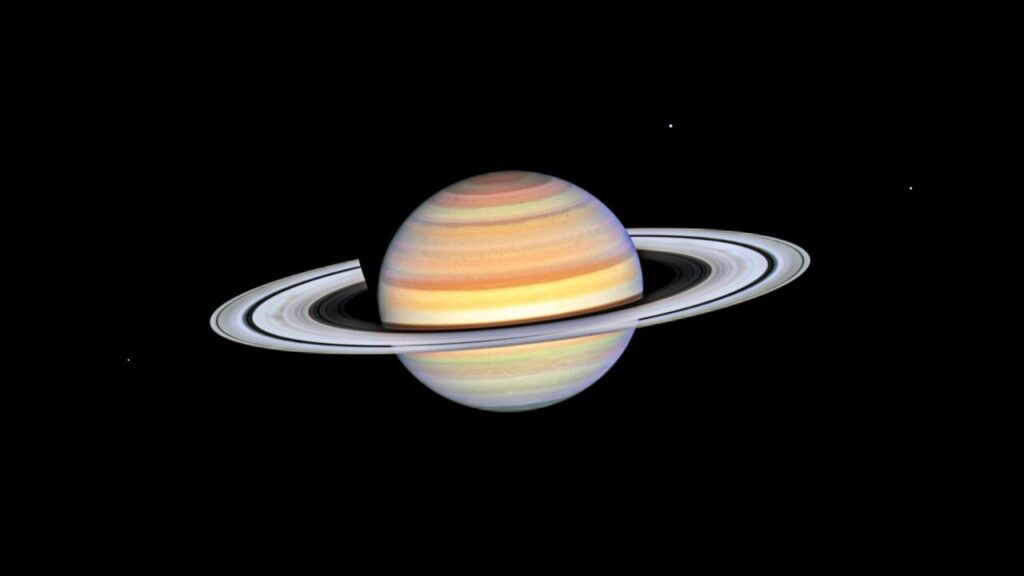
This photo of Saturn was taken by the NASA/ESA Hubble Space Telescope on 22 October 2023, when the ringed planet was approximately 1365 million kilometres from Earth. Hubble’s ultra-sharp vision reveals a phenomenon called ring spokes.
Saturn’s spokes are transient features that rotate along with the rings. Their ghostly appearance only persists for two or three rotations around Saturn. During active periods, freshly-formed spokes continuously add to the pattern.
In 1981, NASA’s Voyager 2 first photographed the ring spokes. Hubble continues observing Saturn annually as the spokes come and go. This cycle has been captured by Hubble’s Outer Planets Atmospheres Legacy (OPAL) program that began nearly a decade ago to annually monitor weather changes on all four gas-giant outer planets.
Hubble’s crisp images show that the frequency of spoke apparitions is seasonally driven, first appearing in OPAL data in 2021 but only on the morning (left) side of the rings. Long-term monitoring shows that both the number and contrast of the spokes vary with Saturn’s seasons. Saturn is tilted on its axis like Earth and has seasons lasting approximately seven years.
This year, these ephemeral structures appear on both sides of the planet simultaneously as they spin around the giant world. Although they look small compared with Saturn, their length and width can stretch longer than Earth’s diameter!
The OPAL team notes that the leading theory is that spokes are tied to interactions between Saturn’s powerful magnetic field and the sun. Planetary scientists think that electrostatic forces generated from this interaction levitate dust or ice above the ring to form the spokes, though after several decades no theory perfectly predicts the spokes. Continued Hubble observations may eventually help solve the mystery. This image was created with Hubble data from proposal 16995 (A. Simon).
This photo of Saturn was taken by the NASA/ESA Hubble Space Telescope on 22 October 2023, when the ringed planet was approximately 1365 million kilometres from Earth. Hubble’s ultra-sharp vision reveals a phenomenon called ring spokes. Saturn’s spokes are transient features that rotate along with the rings. Their ghostly appearance only persists for two or three rotations around Saturn. During active periods, freshly-formed spokes continuously add to the pattern. In 1981, NASA’s Voyager 2 first photographed the ring spokes. Hubble continues observing Saturn annually as the spokes come and go. This cycle has been captured by Hubble’s Outer Planets Atmospheres Legacy (OPAL) program that began nearly a decade ago to annually monitor weather changes on all four gas-giant outer planets. Hubble’s crisp images show that the frequency of spoke apparitions is seasonally driven, first appearing in OPAL data in 2021 but only on the morning (left) side of the rings. Long-term monitoring shows that both the number and contrast of the spokes vary with Saturn’s seasons. Saturn is tilted on its axis like Earth and has seasons lasting approximately seven years. This year, these ephemeral structures appear on both sides of the planet simultaneously as they spin around the giant world. Although they look small compared with Saturn, their length and width can stretch longer than Earth’s diameter! The OPAL team notes that the leading theory is that spokes are tied to interactions between Saturn’s powerful magnetic field and the sun. Planetary scientists think that electrostatic forces generated from this interaction levitate dust or ice above the ring to form the spokes, though after several decades no theory perfectly predicts the spokes. Continued Hubble observations may eventually help solve the mystery. Credit: NASA, ESA, STScI, A. Simon (NASA-GSFC)
To celebrate the holiday season, the NASA/ESA Hubble Space Telescope has captured the galaxy known as UGC 8091, which resembles a sparkling festive snow globe. With a dazzling array of wavelengths of light captured by filters on Hubble’s premier scientific instruments, the millions of stars in this galaxy are being explored in more depth than ever before.
UGC 8091, also known as GR 8, lies around seven million light-years from Earth in the constellation Virgo. Unlike other galaxies whose stars take a more orderly appearance, UGC 8091 is classed by astronomers as an irregular galaxy. It’s not hard to see why — the stars that make up this celestial gathering look more like a brightly shining tangle of string lights than a galaxy. Some irregular galaxies are thought to have become tangled by tumultuous internal activity, while others are known to have formed by interactions with neighbouring galaxies. The result is a class of galaxies with a diverse array of sizes and shapes, including the diffuse scatter of stars that is this galaxy.
In particular, UGC 8091 is a dwarf irregular galaxy, meaning that it only contains around one billion stars. That’s a huge number of lights, but not for a galaxy: our own Milky Way galaxy is thought to encompass over 100 billion stars, and other galaxies can have trillions! Dwarf galaxies often orbit larger galaxies, and their low masses leave them vulnerable to being disturbed and consumed by their bigger neighbours, a process which produces twisted-up dwarf irregulars like UGC 8091.This type of galaxy is thought to have similar characteristics to the enormously old and distant galaxies seen by astronomers in deep-field images. It’s hoped that investigating the composition of dwarf galaxies and their stars, particularly their low metallicity[1], will help to uncover the evolutionary links between these ancient galaxies and more modern galaxies like our own.
To do this, astronomers have been carefully examining the many-coloured stars of UGC 8091. Different features of the galaxy can be picked out by using filters to restrict the light entering Hubble’s instruments to very specific wavelength ranges. Those filtered images can then be recombined to make a full-colour image — an astonishing twelve filters combine to produce this image, with light from the mid-ultraviolet right through to the red end of the visible spectrum contributing. The blossoming patches of red represent light emitted by excited hydrogen molecules in hot, energetic stars that have formed in recent starbursts. The other sparkles on show in this image are a mix of older stars.
The data used in this image date from 2006 to 2021, and were taken by two of Hubble’s most advanced instruments: the Wide Field Camera 3 and the Advanced Camera for Surveys. Among other things, the observing programmes sought to investigate the role of low-mass galaxies, like UGC 8091, in reionising the early Universe, and to examine the results of star formation in low-metallicity galaxies. Despite how small and misshapen they look, dwarf irregular galaxies turn out to hold a great deal of information about our Universe — no less than any of the other celestial lights in our sky.
For the end of the year and the holiday season Hubble has captured the festive bundle of lights known as UGC 8091. UGC 8091, also known as GR 8, lies around seven million light-years from Earth in the constellation Virgo. It is a dwarf irregular galaxy: a comparatively small, low-mass galaxy without a distinct or uniform shape. The filters used in this image date from 2006 up to 2021, and were taken by two of Hubble’s most advanced instruments: the Wide Field Camera 3 and the Advanced Camera for Surveys. An astonishing twelve filters combine to produce this image, with light from the mid-ultraviolet right through to the red end of the visible spectrum contributing. The blossoming patches of red represent light emitted by excited hydrogen molecules in hot, energetic stars that have formed in recent starbursts. The other glittering lights on show are a mix of older stars. Credit: ESA/Hubble, NASA Y. Choi (NOIRLab), K. Gilbert (Space Telescope Science Institute), J. Dalcanton (Flatiron Institute and University of Washington)
Notes
[1] Metallicity is a measure of how much of a star is made up of elements heavier than helium and hydrogen. Such elements are made in the cores of stars, so the first generation of stars in the Universe would have had low metallicity, since there had been no previous stars to make heavier elements. Many dwarf galaxies contain stars with a low level of metallicity.
JWST rings in the holidays with the ringed planet Uranus
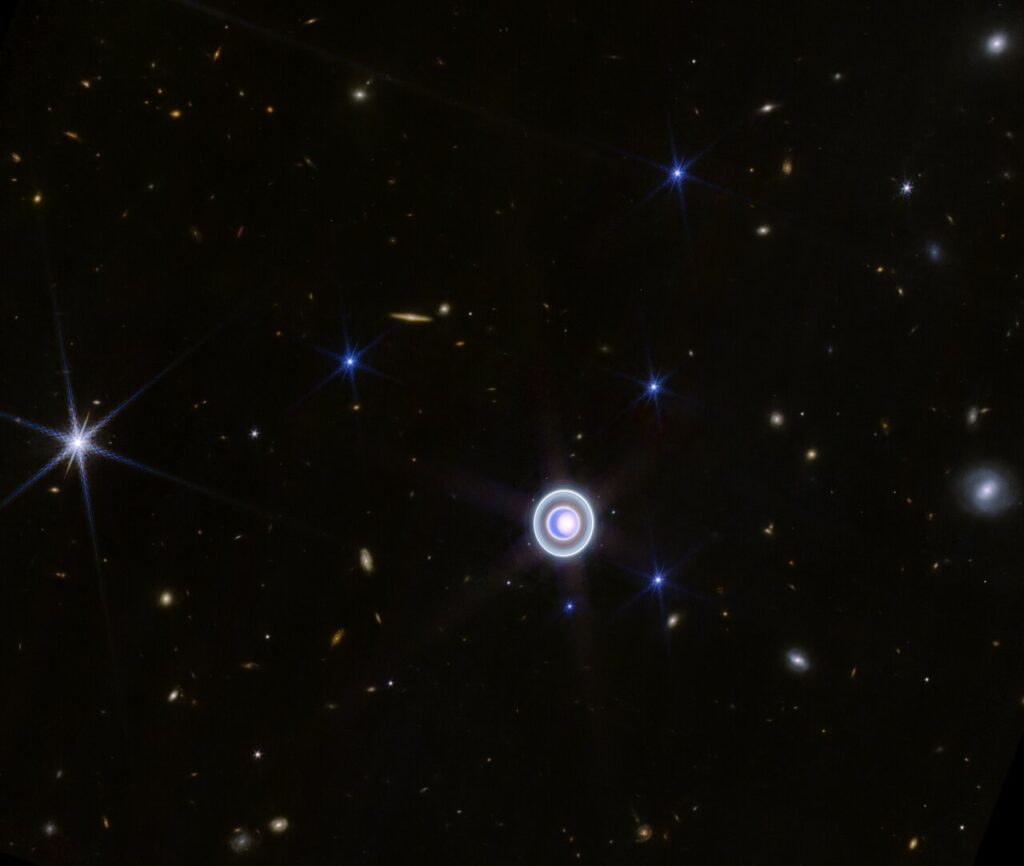
The NASA/ESA/CSA James Webb Space Telescope recently trained its sights on unusual and enigmatic Uranus, an ice giant that spins on its side. Webb captured this dynamic world with rings, moons, storms, and other atmospheric features — including a seasonal polar cap. The image expands upon a two-colour version released earlier this year, adding additional wavelength coverage for a more detailed look.
This image of Uranus from NIRCam (Near-Infrared Camera) on the NASA/ESA/CSA James Webb Space Telescope shows the planet and its rings in new clarity. The planet’s seasonal north polar cap gleams in a bright white, and Webb’s exquisite sensitivity resolves Uranus’ dim inner and outer rings, including the Zeta ring—the extremely faint and diffuse ring closest to the planet. This Webb image also shows 14 of the planet’s 27 moons: Oberon, Titania, Umbriel, Juliet, Perdita, Rosalind, Puck, Belinda, Desdemona, Cressida, Ariel, Miranda, Bianca, and Portia. One day on Uranus is about 17 hours, so the planet’s rotation is relatively quick. This makes it supremely difficult for observatories with a sharp eye like Webb to capture one simple image of the entire planet – storms and other atmospheric features, and the planet’s moons, move visibly within minutes. This image combines several longer and shorter exposures of this dynamic system to correct for those slight changes throughout the observing time. Webb’s extreme sensitivity also picks up a smattering of background galaxies—most appear as orange smudges, and there are two larger, fuzzy white galaxies to the right of the planet in this field of view. Credit: NASA, ESA, CSA, STScI
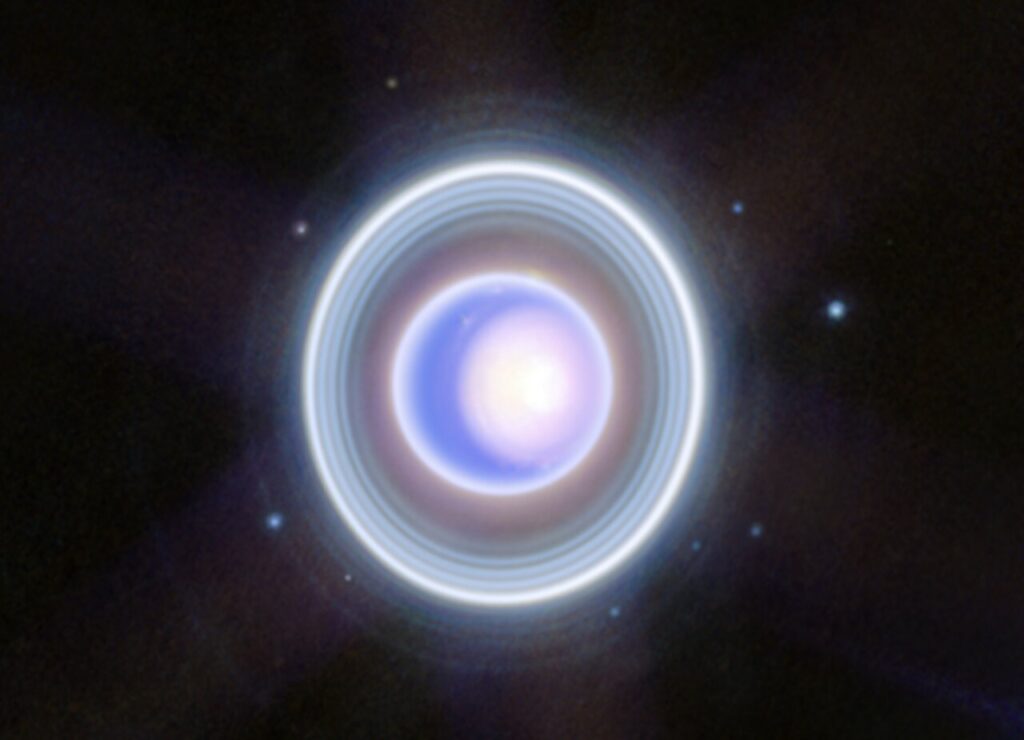
With its exquisite sensitivity, Webb captured Uranus’ dim inner and outer rings, including the elusive Zeta ring—the extremely faint and diffuse ring closest to the planet. It also imaged many of the planet’s 27 known moons, even seeing some small moons within the rings.
In visible wavelengths, Uranus appeared as a placid, solid blue ball. In infrared wavelengths, Webb is revealing a strange and dynamic ice world filled with exciting atmospheric features.
One of the most striking of these is the planet’s seasonal north polar cap. Compared to the image from earlier this year, some details of the cap are easier to see in these newer images. These include the bright, white, inner cap and the dark lane in the bottom of the polar cap, toward the lower latitudes.
Several bright storms can also be seen near and below the southern border of the polar cap. The number of these storms, and how frequently and where they appear in Uranus’s atmosphere, might be due to a combination of seasonal and meteorological effects.
This image of Uranus from NIRCam (Near-Infrared Camera) on the NASA/ESA/CSA James Webb Space Telescope shows the planet and its rings in new clarity. The Webb image exquisitely captures Uranus’s seasonal north polar cap, including the bright, white, inner cap and the dark lane in the bottom of the polar cap. Uranus’ dim inner and outer rings are also visible in this image, including the elusive Zeta ring—the extremely faint and diffuse ring closest to the planet. This Webb image also shows 9 of the planet’s 27 moons. They are the blue dots that surround the planet’s rings. Clockwise starting at 2 o’clock, they are: Rosalind, Puck, Belinda, Desdemona, Cressida, Bianca, Portia, Juliet, and Perdita. The orbits of these moons share the 98-degree tilt of their parent planet relative to the plane of the solar system. One day on Uranus is about 17 hours, so the planet’s rotation is relatively quick. This makes it supremely difficult for observatories with a sharp eye like Webb to capture one simple image of the entire planet – storms and other atmospheric features, and the planet’s moons, move visibly within minutes. This image combines several longer and shorter exposures of this dynamic system to correct for those slight changes throughout the observing time. Credit: NASA, ESA, CSA, STScI
The polar cap becomes prominent when the planet’s pole begins to point towards the Sun, as it approaches solstice and receives more sunlight. Uranus reaches its next solstice in 2028, and astronomers are eager to watch any possible changes in the structure of these features. Webb will help disentangle the seasonal and meteorological effects that influence Uranus’s storms, which is critical to help astronomers understand the planet’s complex atmosphere.
Because Uranus orbits on its side at a tilt of about 98 degrees, it has the most extreme seasons in the Solar System. For nearly a quarter of each Uranian year, the Sun shines over one pole, plunging the other half of the planet into a dark, 21-year-long winter.
With Webb’s unparalleled infrared resolution and sensitivity, astronomers now see Uranus and its unique features with groundbreaking new clarity. These details, especially of the close-in Zeta ring, will be invaluable to planning any future missions to Uranus.
Uranus can also serve as a proxy for studying the many far-off, similarly sized exoplanets that have been discovered in the last few decades. This “exoplanet in our backyard” can help astronomers understand how planets of this size work, what their meteorology is like, and how they formed. This can in turn help us understand our own solar system as a whole by placing it in a larger context.
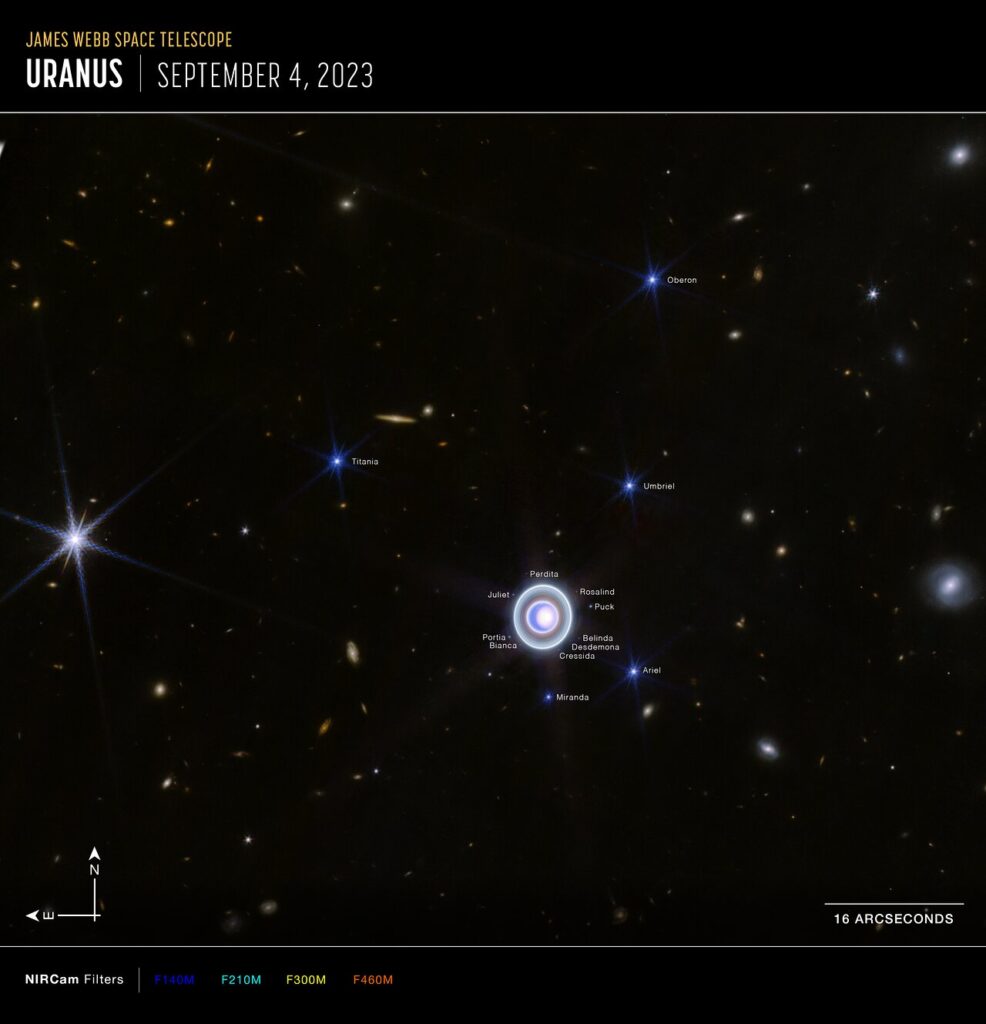
This image of Uranus, captured by Webb’s Near-Infrared Camera (NIRCam), shows compass arrows, scale bar, and colour key for reference. The north and east compass arrows show the orientation of the image on the sky. Note that the relationship between north and east on the sky (as seen from below) is flipped relative to direction arrows on a map of the ground (as seen from above). The scale bar is labelled 16 arcseconds. The length of the scale bar is approximately one-seventh the total width of the image This image shows invisible near-infrared wavelengths of light that have been translated into visible-light colours. The colour key shows which NIRCam filters were used when collecting the light. The colour of each filter name is the visible light colour used to represent the infrared light that passes through that filter. Webb’s NIRCam filters for this image are F140M (blue), F210M (cyan), F300M (yellow), and F460M (orange). Credit: NASA, ESA, CSA, STScI
Webb identifies tiniest free-floating brown dwarf in star cluster IC 348
The discovery helps answer the question: How small can you go when forming stars?
Brown dwarfs are sometimes called failed stars, since they form like stars through gravitational collapse, but never gain enough mass to ignite nuclear fusion. The smallest brown dwarfs can overlap in mass with giant planets. In a quest to find the smallest brown dwarf, astronomers using the NASA/ESA/CSA James Webb Space Telescope have found the new record-holder: an object weighing just three to four times the mass of Jupiter.
This image from the NIRCam (Near-Infrared Camera) instrument on NASA’s James Webb Space Telescope shows the central portion of the star cluster IC 348. Astronomers combed the cluster in search of tiny, free-floating brown dwarfs: objects too small to be stars but larger than most planets. They found three brown dwarfs that are less than eight times the mass of Jupiter, which are circled in the main image and shown in the detailed pullouts at right. The smallest weighs just three to four times as much as Jupiter, challenging theories for star formation. The wispy curtains filling the image are interstellar material reflecting the light from the cluster’s stars — what is known as a reflection nebula. The material also includes carbon-containing molecules known as polycyclic aromatic hydrocarbons, or PAHs. The bright star closest to the centre of the frame is actually a pair of type B stars in a binary system, the most massive stars in the cluster. Winds from these stars may help sculpt the large loop seen on the right side of the field of view. Credit: NASA, ESA, CSA, STScI, and K. Luhman (Penn State University) and C. Alves de Oliveira (European Space Agency)
Brown dwarfs are objects that straddle the dividing line between stars and planets. They form like stars, growing dense enough to collapse under their own gravity, but they never become dense and hot enough to begin fusing hydrogen and turn into a star. At the low end of the scale, some brown dwarfs are comparable with giant planets, weighing just a few times the mass of Jupiter.
Astronomers are trying to determine the smallest object that can form in a star-like manner. An international team using the NASA/ESA/CSA James Webb Space Telescope has identified the new record-holder: a tiny, free-floating brown dwarf with only three to four times the mass of Jupiter.
“One basic question you’ll find in every astronomy textbook is, what are the smallest stars? That’s what we’re trying to answer,” explained lead author Kevin Luhman of Pennsylvania State University.
To locate this newfound brown dwarf, Luhman and his colleague, Catarina Alves de Oliveira, chose to study the star cluster IC 348, located about 1000 light-years away in the Perseus star-forming region. This cluster is young, only about five million years old. As a result, any brown dwarfs would still be relatively bright in infrared light, glowing from the heat of their formation.
The team first imaged the centre of the cluster using Webb’s NIRCam (Near-Infrared Camera) to identify brown dwarf candidates from their brightness and colours. They followed up on the most promising targets using Webb’s NIRSpec (Near-Infrared Spectrograph) microshutter array.
Webb’s infrared sensitivity was crucial, allowing the team to detect fainter objects than ground-based telescopes. In addition, Webb’s sharp vision enabled them to determine which red objects were pinpoint brown dwarfs and which were blobby background galaxies.
This image of star cluster IC 348, captured by Webb’s NIRCam (Near-Infrared Camera) instrument, shows compass arrows, a scale bar, and a colour key for reference. The north and east compass arrows show the orientation of the image on the sky. Note that the relationship between north and east on the sky (as seen from below) is flipped relative to direction arrows on a map of the ground (as seen from above). The scale bar is labelled in light-years, which is the distance that light travels in one Earth-year. (It takes 0.1 years for light to travel a distance equal to the length of the scale bar.) One light-year is equal to about 5.88 trillion miles or 9.46 trillion kilometres. The field of view shown in this image is approximately 0.5 light-years across and 0.8 light-years high. This image shows invisible near-infrared wavelengths of light that have been translated into visible-light colours. The colour key shows which NIRCam filters were used when collecting the light. The colour of each filter name is the visible light colour used to represent the infrared light that passes through that filter. Credit: NASA, ESA, CSA, STScI, and K. Luhman (Penn State University) and C. Alves de Oliveira (European Space Agency)
This winnowing process led to three intriguing targets weighing three to eight Jupiter masses, with surface temperatures ranging from 830 to 1500 degrees Celsius. The smallest of these weighs just three to four times Jupiter, according to computer models.
Explaining how such a small brown dwarf could form is theoretically challenging. A heavy and dense cloud of gas has plenty of gravity to collapse and form a star. However, because of its weaker gravity, it should be more difficult for a small cloud to collapse to form a brown dwarf, and that is especially true for brown dwarfs with the masses of giant planets.
“It’s pretty easy for current models to make giant planets in a disc around a star,” said Catarina Alves de Oliveira of ESA, principal investigator on the observing program. “But in this cluster, it would be unlikely that this object formed in a disc, instead forming like a star, and three Jupiter masses is 300 times smaller than our Sun. So we have to ask, how does the star formation process operate at such very, very small masses?”
In addition to providing clues about the star formation process, tiny brown dwarfs also can help astronomers better understand exoplanets. The least massive brown dwarfs overlap with the largest exoplanets; therefore, they would be expected to have some similar properties. However, a free-floating brown dwarf is easier to study than a giant exoplanet since the latter is hidden within the glare of its host star.
Two of the brown dwarfs identified in this survey show the spectral signature of an unidentified hydrocarbon, a molecule containing both hydrogen and carbon atoms. The same infrared signature was detected by NASA’s Cassini mission in the atmospheres of Saturn and its moon Titan. It has also been seen in the interstellar medium, the gas between stars.
“This is the first time we’ve detected this molecule in the atmosphere of an object outside our Solar System,” explained Alves de Oliveira. “Models for brown dwarf atmospheres don’t predict its existence. We’re looking at objects with younger ages and lower masses than we ever have before, and we’re seeing something new and unexpected.”
Since the objects are well within the mass range of giant planets, it raises the question of whether they are indeed brown dwarfs, or in fact rogue planets that were ejected from planetary systems. While the team can’t rule out the latter, they argue that they are far more likely to be brown dwarfs than an ejected planets.
An ejected giant planet is unlikely for two reasons. First, such planets are uncommon in general compared to planets with smaller masses. Second, most stars are low-mass stars, and giant planets are especially rare among those stars. As a result, it’s unlikely that most of the stars in IC 348 (which are low-mass stars) are capable of producing such massive planets. In addition, since the cluster is only five million years old, there probably hasn’t been enough time for giant planets to form and then be ejected from their systems.
The discovery of more such objects will help clarify their status. Theories suggest that rogue planets are more likely to be found in the outskirts of a star cluster, so expanding the search area may identify them if they exist within IC 348.
Future work may also include longer surveys that can detect fainter, smaller objects. The short survey conducted by the team was expected to detect objects as small as twice the mass of Jupiter. Longer surveys could easily reach one Jupiter mass.
These observations were taken as part of Guaranteed Time Observation program #1229. The results were published in the Astronomical Journal.
This image from the NIRCam (Near-Infrared Camera) instrument on the NASA/ESA/CSA James Webb Space Telescope shows the central portion of the star cluster IC 348. Astronomers combed the cluster in search of tiny, free-floating brown dwarfs: objects too small to be stars but larger than most planets. They found three brown dwarfs that are less than eight times the mass of Jupiter. The smallest weighs just three to four times as much as Jupiter, challenging theories for star formation. The wispy curtains filling the image are interstellar material reflecting the light from the cluster’s stars — what is known as a reflection nebula. The material also includes carbon-containing molecules known as polycyclic aromatic hydrocarbons, or PAHs. The bright star closest to the centre of the frame is actually a pair of type B stars in a binary system, the most massive stars in the cluster. Winds from these stars may help sculpt the large loop seen on the right side of the field of view. Credit: NASA, ESA, CSA, STScI, and K. Luhman (Penn State University) and C. Alves de Oliveira (European Space Agency)
Researchers stunned by Webb’s new high-definition look at an exploded star, the Cassiopeia A supernova remnant
Like a shiny, round ornament ready to be placed in the perfect spot on the holiday tree, supernova remnant Cassiopeia A (Cas A) gleams in a new image from the NASA/ESA/CSA James Webb Space Telescope. However, this scene is no proverbial silent night — all is not calm.
A new high-definition image from the NASA/ESA/CSA James Webb Space Telescope’s NIRCam (Near-Infrared Camera) unveils intricate details of supernova remnant Cassiopeia A (Cas A), and shows the expanding shell of material slamming into the gas shed by the star before it exploded. The most noticeable colours in Webb’s newest image are clumps of bright orange and light pink that make up the inner shell of the supernova remnant. These tiny knots of gas, composed of sulphur, oxygen, argon, and neon from the star itself, are only detectable thanks to NIRCam’s exquisite resolution, and give researchers a hint at how the dying star shattered like glass when it exploded. The outskirts of the main inner shell look like smoke from a campfire. This marks where ejected material from the exploded star is ramming into surrounding circumstellar material. Researchers have concluded that this white colour is light from synchrotron radiation, which is generated by charged particles travelling at extremely high speeds and spiralling around magnetic field lines. There are also several light echoes visible in this image, most notably in the bottom right corner. This is where light from the star’s long-ago explosion has reached, and is warming, distant dust, which glows as it cools down. Credit: NASA, ESA, CSA, STScI, D. Milisavljevic (Purdue University), T. Temim (Princeton University), I. De Looze (University of Gent)
Webb’s NIRCam (Near-Infrared Camera) view of Cas A displays a very violent explosion at a resolution previously unreachable at these wavelengths. This high-resolution look unveils intricate details of the expanding shell of material slamming into the gas shed by the star before it exploded.
Cas A is one of the best-studied supernova remnants in all the cosmos. Over the years, ground-based and space-based observatories, including the NASA/ESA Hubble Space Telescope, have collectively assembled a multiwavelength picture of the object’s tattered remains.
However, astronomers have now entered a new era in the study of Cas A. In April 2023, Webb’s MIRI (Mid-Infrared Instrument) started this story, revealing new and unexpected features within the inner shell of the supernova remnant. But many of those features are invisible in the new NIRCam image, and astronomers are investigating why that is.
This image highlights several interesting features of the supernova remnant Cassiopeia A (Cas A), as seen with Webb’s NIRCam (Near-Infrared Camera). NIRCam’s exquisite resolution is able to detect tiny knots of gas, composed of sulphur, oxygen, argon, and neon from the star itself. Some filaments of debris are too tiny to be resolved, even by Webb, meaning that they are comparable to or less than 16 billion kilometres across (around 100 astronomical units). Researchers consider that this represents how the star shattered like glass when it exploded. Circular holes visible in the MIRI image within the Green Monster, a loop of green light in Cas A’s inner cavity, are faintly outlined in white and purple emission in the NIRCam image — this represents ionised gas. Researchers believe this is due to the supernova debris pushing through and sculpting gas left behind by the star before it exploded. This is one of a few light echoes visible in NIRCam’s image of Cas A. A light echo occurs when light from the star’s long-ago explosion has reached, and is warming, distant dust, which glows as it cools down. NIRCam captured a particularly intricate and large light echo, nicknamed Baby Cas A by researchers. It is actually located about 170 light-years behind the supernova remnant. Credit: NASA, ESA, CSA, STScI, D. Milisavljevic (Purdue University), T. Temim (Princeton University), I. De Looze (University of Gent)
Infrared light is invisible to our eyes, so image processors and scientists represent these wavelengths of light with visible colours. In this newest image of Cas A, colours were assigned to NIRCam’s different filters, and each of those colours hints at different activity occurring within the object.
At first glance, the NIRCam image may appear less colourful than the MIRI image. However, this does not mean there is less information: it simply comes down to the wavelengths in which the material in the object is emitting its light.
This image provides a side-by-side comparison of supernova remnant Cassiopeia A (Cas A) as captured by the NASA/ESA/CSA James Webb Space Telescope’s NIRCam (Near-Infrared Camera) and MIRI (Mid-Infrared Instrument). At first glance, Webb’s NIRCam image appears less colourful than the MIRI image. But this is only because the material from the object is emitting light at many different wavelengths The NIRCam image appears a bit sharper than the MIRI image because of its greater resolution. The outskirts of the main inner shell, which appeared as a deep orange and red in the MIRI image, look like smoke from a campfire in the NIRCam image. This marks where the supernova blast wave is ramming into surrounding circumstellar material. The dust in the circumstellar material is too cool to be detected directly at near-infrared wavelengths, but lights up in the mid-infrared. Also not seen in the near-infrared view is the loop of green light in the central cavity of Cas A that glowed in mid-infrared light, nicknamed the Green Monster by the research team. The circular holes visible in the MIRI image within the Green Monster, however, are faintly outlined in white and purple emission in the NIRCam image. Credit: NASA, ESA, CSA, STScI, D. Milisavljevic (Purdue University), T. Temim (Princeton University), I. De Looze (University of Gent)
The most noticeable colours in Webb’s newest image are clumps of bright orange and light pink that make up the inner shell of the supernova remnant. Webb’s razor-sharp view can detect the tiniest knots of gas, composed of sulphur, oxygen, argon, and neon from the star itself. Embedded in this gas is a mixture of dust and molecules, which will eventually be incorporated into new stars and planetary systems. Some filaments of debris are too tiny to be resolved, even by Webb, meaning that they are comparable to or less than 16 billion kilometres across (around 100 astronomical units). In comparison, the entirety of Cas A spans 10 light-years, or roughly 96 trillion kilometres.
When comparing Webb’s new near-infrared view of Cas A with the mid-infrared view, its inner cavity and outermost shell are curiously devoid of colour. The outskirts of the main inner shell, which appeared as a deep orange and red in the MIRI image, now look like smoke from a campfire. This marks where the supernova blast wave is ramming into the surrounding circumstellar material. The dust in the circumstellar material is too cool to be detected directly at near-infrared wavelengths, but lights up in the mid-infrared.
Researchers have concluded that the white colour is light from synchrotron radiation, which is emitted across the electromagnetic spectrum, including the near-infrared. It’s generated by charged particles travelling at extremely high speeds and spiralling around magnetic field lines. Synchrotron radiation is also visible in the bubble-like shells in the lower half of the inner cavity.
Also not seen in the near-infrared view is the loop of green light in the central cavity of Cas A that glowed in mid-infrared light, appropriately nicknamed the Green Monster by the research team. This feature was described as ‘challenging to understand’ by researchers at the time of their first look.
While the ‘green’ of the Green Monster is not visible in NIRCam, what’s left over in the near-infrared in that region can provide insight into the mysterious feature. The circular holes visible in the MIRI image are faintly outlined in white and purple emission in the NIRCam image — this represents ionised gas. Researchers believe this is due to the supernova debris pushing through and sculpting gas left behind by the star before it exploded.
Researchers were also absolutely stunned by one fascinating feature at the bottom right corner of NIRCam’s field of view. They’re calling that large, striated blob Baby Cas A — because it appears like an offspring of the main supernova.
This is a light echo. Light from the star’s long-ago explosion has reached, and is warming, distant dust, which glows as it cools down. The intricacy of the dust pattern, and Baby Cas A’s apparent proximity to Cas A itself, are particularly intriguing to researchers. In actuality, Baby Cas A is located about 170 light-years behind the supernova remnant.
There are also several other, smaller light echoes scattered throughout Webb’s new portrait.
The Cas A supernova remnant is located 11 000 light-years away in the constellation Cassiopeia. It’s estimated to have exploded about 340 years ago from our point of view.
This image of the Cassiopeia A supernova remnant, captured by Webb’s NIRCam (Near-Infrared Camera) shows compass arrows, a scale bar, and a colour key for reference. The north and east compass arrows show the orientation of the image on the sky. The scale bar is labeled in light-years, which is the distance that light travels in one Earth-year (it takes 3 years for light to travel a distance equal to the length of the scale bar). One light-year is equal to about 9.46 trillion kilometers. This image shows invisible near-infrared wavelengths of light that are represented by visible-light colours. The colour key shows which NIRCam filters were used when collecting the light. The colour of each filter name is the visible-light colour used to represent the infrared light that passes through that filter. Credit: NASA, ESA, CSA, STScI, D. Milisavljevic (Purdue University), T. Temim (Princeton University), I. De Looze (University of Gent)
The protoplanetary disc XUE 1 shows that rocky planets can form in extreme environments; the study has been published in The Astrophysical Journal
An international team of astronomers have used the NASA/ESA/CSA James Webb Space Telescope to provide the first observation of water and other molecules in the inner, rocky-planet-forming regions of a disc in one of the most extreme environments in our Galaxy. These results suggest that the conditions for rocky-planet formation, typically found in the discs of low-mass star-forming regions, can also occur in massive-star-forming regions and possibly a broader range of environments.
This is an artist’s impression of a young star surrounded by a protoplanetary disc in which planets are forming. An international team of astronomers have used the NASA/ESA/CSA James Webb Space Telescope to provide the first observation of water and other molecules in the inner, rocky-planet-forming regions of a disc in one of the most extreme environments in our galaxy. These results suggest that the conditions for rocky-planet formation, typically found in the discs of low-mass star-forming regions, can also occur in massive-star-forming regions and possibly a broader range of environments. Credit: ESO/L. Calçada
These are the first results from the eXtreme UV Environments (XUE) James Webb Space Telescope programme, that focuses on the characterisation of planet-forming disc in massive-star-forming regions. These regions are likely representative of the environment in which most planetary systems formed. Understanding the impact of environment on planet formation is important for scientists to gain insights into the diversity of the observed exoplanet populations.
The XUE programme targets a total of 15 discs in three areas of the Lobster Nebula (also known as NGC 6357), a large emission nebula roughly 5500 light-years away from Earth in the constellation Scorpius. The Lobster Nebula is one of the youngest and closest massive star formation complexes, and is host to some of the most massive stars in our Galaxy. Massive stars are hotter, and therefore emit more ultraviolet (UV) radiation. This can disperse the gas, making the expected disc lifetime as short as a million years. Thanks to Webb, astronomers can now study the effect of UV radiation on the inner rocky-planet-forming regions of protoplanetary discs around stars like our Sun.
“Webb is the only telescope with the spatial resolution and sensitivity to study planet-forming discs in massive-star-forming regions,” said team lead María Claudia Ramírez-Tannus of the Max Planck Institute for Astronomy in Germany.
Astronomers aim to characterise the physical properties and chemical composition of the rocky-planet-forming regions of discs in the Lobster Nebula using Webb’s Medium Resolution Spectrometer (MRS) of the Mid-InfraRed Instrument (MIRI). This first result focuses on the protoplanetary disc termed XUE 1, which is located in the star cluster Pismis 24.
This graphic presents some of the first results from the eXtreme UV Environments (XUE) James Webb Space Telescope programme. These results suggest that the conditions for rocky-planet formation, typically found in the discs of low-mass star-forming regions, can also occur in massive-star-forming regions and possibly a broader range of environments. Astronomers focussed on rocky-planet-forming regions of discs in the Lobster Nebula using Webb’s Medium Resolution Spectrometer (MRS) of the Mid-InfraRed Instrument (MIRI). This first result focuses on the protoplanetary disc termed XUE 1, which is located in the star cluster Pismis 24. This graphic features the observed signatures of carbon monoxide spanning 4.95 to 5.15 microns Credit: NASA, ESA, CSA, STScI, J. Olmsted (STScI), M. C Ramírez-Tannus (Max Planck Institute for Astronomy)This graphic presents some of the first results from the eXtreme UV Environments (XUE) James Webb Space Telescope programme. These results suggest that the conditions for rocky-planet formation, typically found in the discs of low-mass star-forming regions, can also occur in massive-star-forming regions and possibly a broader range of environments. Astronomers focussed on rocky-planet-forming regions of discs in the Lobster Nebula using Webb’s Medium Resolution Spectrometer (MRS) of the Mid-InfraRed Instrument (MIRI). This first result focuses on the protoplanetary disc termed XUE 1, which is located in the star cluster Pismis 24. The inner disc around XUE 1 revealed signatures of water (highlighted here in blue and centred around 14.2 microns), as well as acetylene (C2H2, highlighted in green; centred around 13.7 microns), hydrogen cyanide (HCN, highlighted in brown; centred around 14.0 microns), and carbon dioxide (CO2, highlighted in red; centred around 14.95 microns). As indicated, some of the emission detected was weaker than some of the predicted models, which might imply a small outer disc radius. Credit: NASA, ESA, CSA, STScI, J. Olmsted (STScI), M. C Ramírez-Tannus (Max Planck Institute for Astronomy)
“Only the MIRI wavelength range and spectral resolution allow us to probe the molecular inventory and physical conditions of the warm gas and dust where rocky planets form,” said team member Arjan Bik of Stockholm University in Sweden.
Because of its location near several massive stars in NGC6357, scientists expect XUE 1 to have been constantly exposed to a high ultraviolet radiation field throughout its life. However, in this extreme environment the team still detected a range of molecules that are the building blocks of rocky planets.
“We find that the inner disk around XUE 1 is remarkably similar to those in nearby star-forming regions,” said team member Rens Waters of Radboud University in the Netherlands. “We’ve detected water and other molecules like carbon monoxide, carbon dioxide, hydrogen cyanide and acetylene. However, the emission found was weaker than some models predicted. This might imply a small outer disc radius.”
“We were surprised and excited because this is the first time that these molecules have been detected under such extreme conditions,” added Lars Cuijpers of Radboud University. The team also found small, partially crystalline silicate dust at the disc’s surface. This is considered to be the building blocks of rocky planets.
These results are good news for rocky planet formation, as the science team finds that the conditions in the inner disc resemble those found in the well-studied disks located in nearby star-forming regions, where only low-mass stars form. This suggests that rocky planets can form in a much broader range of environments than previously believed.
The team notes that the remaining observations from the XUE programme are crucial to establishing the commonality of these conditions.
“XUE1 shows us that the conditions to form rocky planets are there, so the next step is to check how common that is,” says Ramírez-Tannus. “We will observe other discs in the same region to determine the frequency with which these conditions can be observed.”
These results have been published in The Astrophysical Journal.