Six billion tonnes a second: rogue planet Cha 1107-7626 found growing at record rate
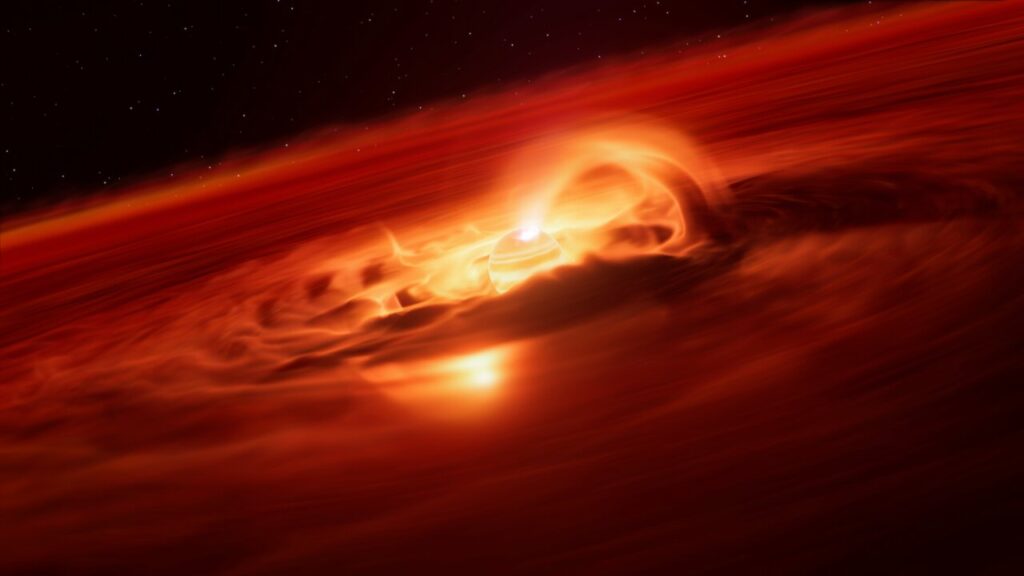
Astronomers have identified an enormous ‘growth spurt’ in a so-called rogue planet. Unlike the planets in our Solar System, these objects do not orbit stars, free-floating on their own instead. The new observations, made with the European Southern Observatory’s Very Large Telescope (ESO’s VLT), reveal that this free-floating planet is eating up gas and dust from its surroundings at a rate of six billion tonnes a second. This is the strongest growth rate ever recorded for a rogue planet, or a planet of any kind, providing valuable insights into how they form and grow.
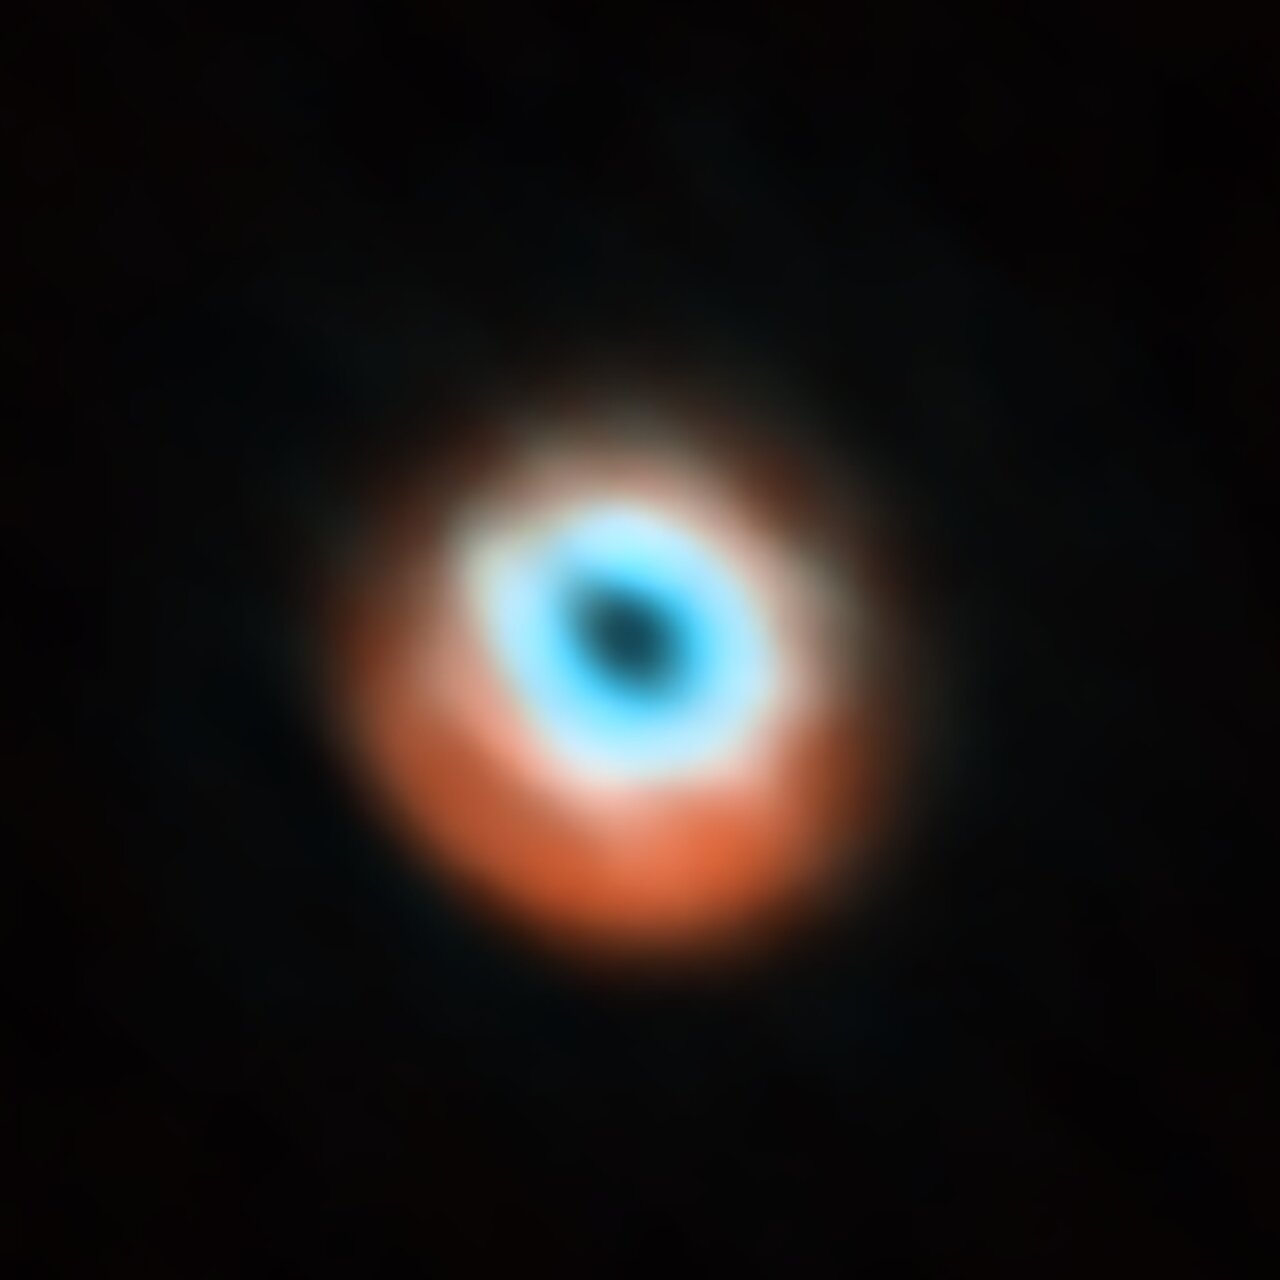
This artist’s impression shows Cha 1107-7626. Located about 620 light-years away, this rogue planet is about 5-10 times more massive than Jupiter and doesn’t orbit a star. It is eating up material from a disc around it and, using ESO’s Very Large Telescope (VLT), astronomers have discovered that it is now doing so at a rate of six billion tonnes per second –– the fastest ever found for any kind of planet. The team suspects that strong magnetic fields could be funnelling material towards the planet, something only seen in stars. When the infalling material reaches the planet it heats up its surface, creating a bright hot spot. The X-shooter spectrograph on ESO’s VLT detected a marked brightening in mid-2025, and found a clear fingerprint that this was caused by infalling gas. The observations show that the planet is now accreting matter about 8 times faster than a few months before. Credit: ESO/L. Calçada/M. Kornmesser
“People may think of planets as quiet and stable worlds, but with this discovery we see that planetary-mass objects freely floating in space can be exciting places,”
says Víctor Almendros-Abad, an astronomer at the Astronomical Observatory of Palermo, National Institute for Astrophysics (INAF), Italy and lead author of the new study.
The newly studied object, which has a mass five to 10 times the mass of Jupiter, is located about 620 light-years away in the constellation Chamaeleon. Officially named Cha 1107-7626, this rogue planet is still forming and is fed by a surrounding disc of gas and dust. This material constantly falls onto the free-floating planet, a process known as accretion. However, the team led by Almendros-Abad has now found that the rate at which the young planet is accreting is not steady.
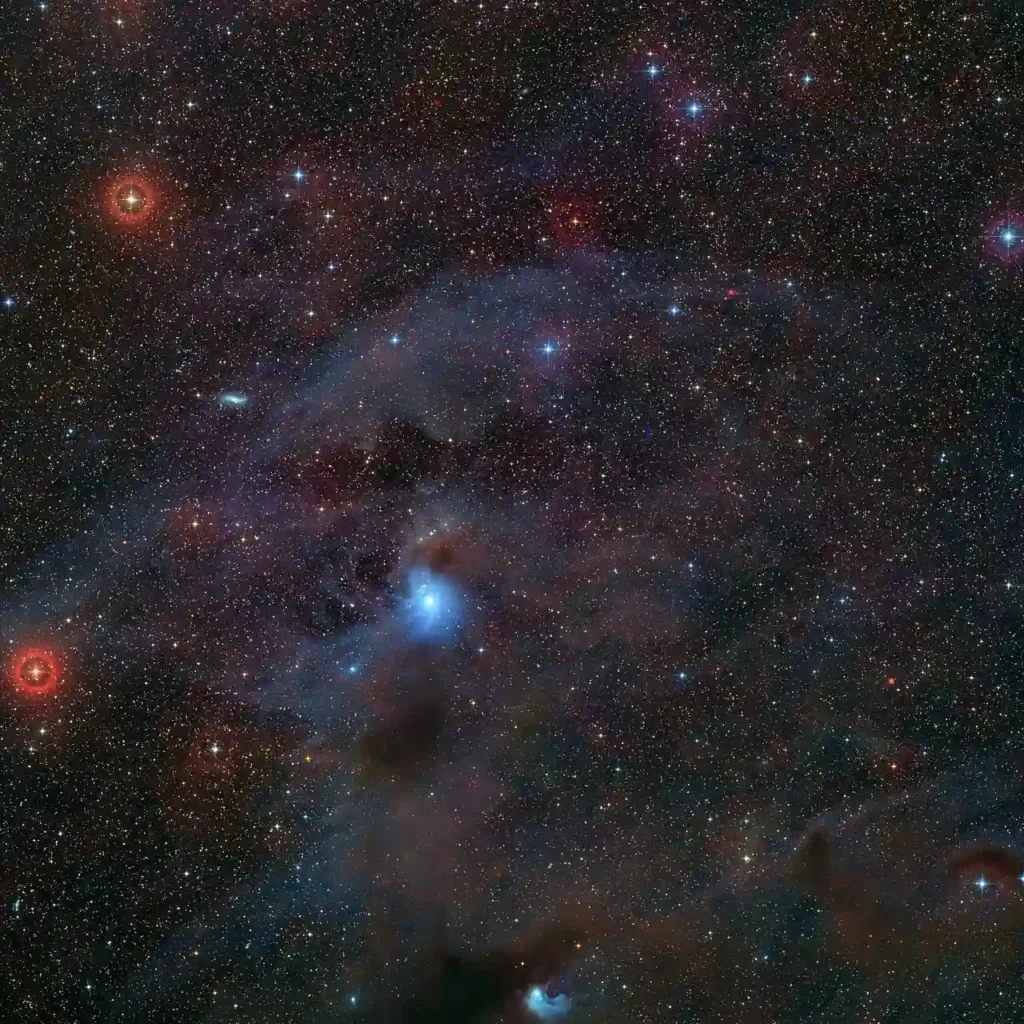
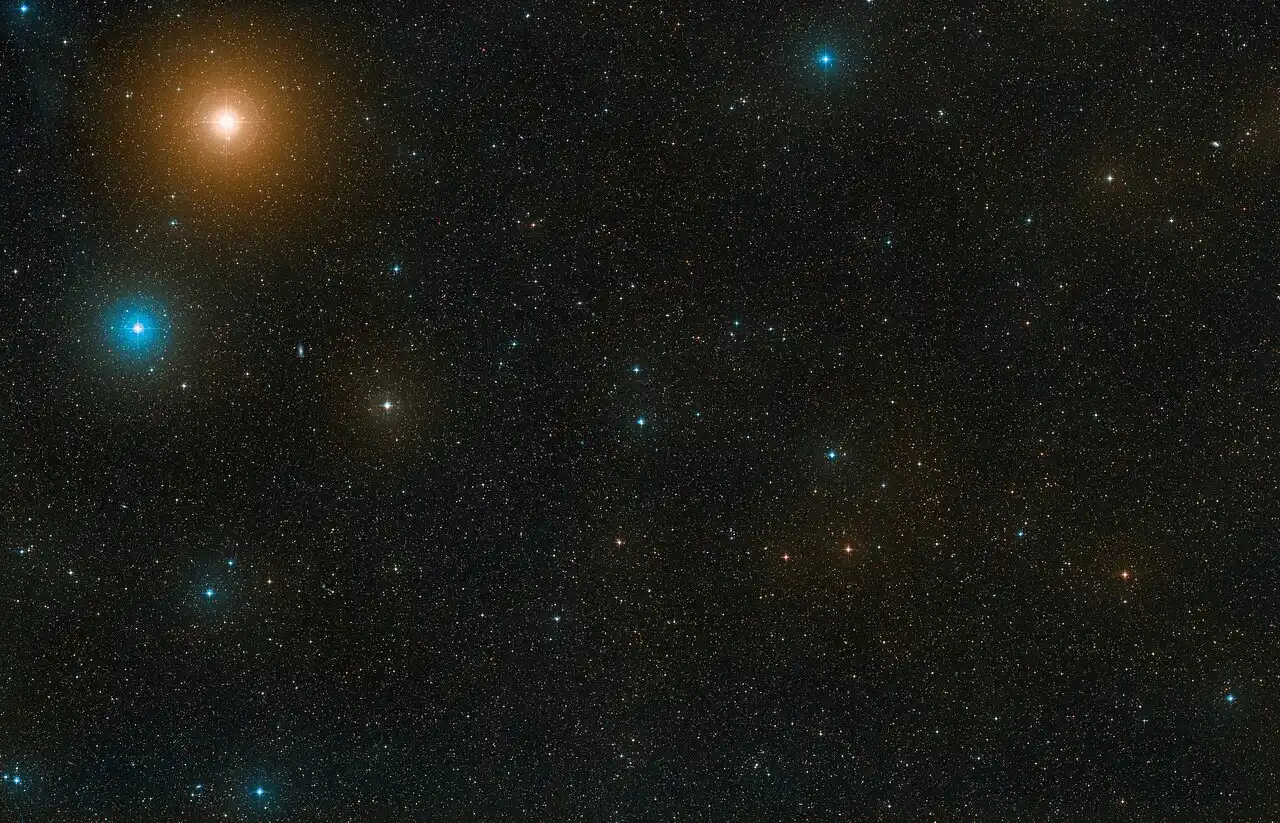
This infrared image, taken with ESO’s Visible and Infrared Telescope for Astronomy (VISTA) shows the position in the sky of the rogue planet Cha 1107-7626. The planet is a dot located exactly at the centre of the frame. Credit: ESO/Meingast et al.
By August 2025, the planet was accreting about eight times faster than just a few months before, at a rate of six billion tonnes per second!
“This is the strongest accretion episode ever recorded for a planetary-mass object,”
says Almendros-Abad. The discovery, published today in The Astrophysical Journal Letters, was made with the X-shooter spectrograph on ESO’s VLT, located in Chile’s Atacama Desert. The team also used data from the James Webb Space Telescope, operated by the US, European and Canadian space agencies, and archival data from the SINFONI spectrograph on ESO’s VLT.
“The origin of rogue planets remains an open question: are they the lowest-mass objects formed like stars, or giant planets ejected from their birth systems?”
asks co-author Aleks Scholz, an astronomer at the University of St Andrews, United Kingdom. The findings indicate that at least some rogue planets may share a similar formation path to stars since similar bursts of accretion have been spotted in young stars before. As co-author Belinda Damian, also an astronomer at the University of St Andrews, explains:
“This discovery blurs the line between stars and planets and gives us a sneak peek into the earliest formation periods of rogue planets.”
By comparing the light emitted before and during the burst, astronomers gathered clues about the nature of the accretion process. Remarkably, magnetic activity appears to have played a role in driving the dramatic infall of mass, something that has only been observed in stars before. This suggests that even low-mass objects can possess strong magnetic fields capable of powering such accretion events. The team also found that the chemistry of the disc around the planet changed during the accretion episode, with water vapour being detected during it but not before. This phenomenon had been spotted in stars but never in a planet of any kind.
This visible-light image, part of the Digitized Sky Survey 2, shows the position in the sky of the rogue planet Cha 1107-7626. The planet (not visible here) is located exactly at the centre of the frame. Credit: ESO/ Digitized Sky Survey 2
Free-floating planets are difficult to detect, as they are very faint, but ESO’s upcoming Extremely Large Telescope (ELT), operating under the world’s darkest skies for astronomy, could change that. Its powerful instruments and giant main mirror will enable astronomers to uncover and study more of these lonely planets, helping them to better understand how star-like they are. As co-author and ESO astronomer Amelia Bayo puts it:
“The idea that a planetary object can behave like a star is awe-inspiring and invites us to wonder what worlds beyond our own could be like during their nascent stages.”
More information
This research was presented in a paper titled “Discovery of an Accretion Burst in a Free-Floating Planetary-Mass Object” to appear in The Astrophysical Journal Letters (doi:10.3847/2041-8213/ae09a8).
The team is composed of V. Almendros-Abad (Istituto Nazionale di Astrofisica – Osservatorio Astronomico di Palermo, Italy), Aleks Scholz (School of Physics & Astronomy, University of St Andrews, United Kingdom [St Andrews]), Belinda Damian (St Andrews), Ray Jayawardhana (Department of Physics & Astronomy, Johns Hopkins University, USA [JHU]), Amelia Bayo (European Southern Observatory, Germany), Laura Flagg (JHU), Koraljka Mužić (Instituto de Astrofísica e Ciências do Espaço, Faculdade de Ciências, Universidade de Lisboa, Portugal), Antonella Natta (School of Cosmic Physics, Dublin Institute for Advanced Studies and University College Dublin, Ireland) Paola Pinilla (Mullard Space Science Laboratory, University College London, UK) and Leonardo Testi (Dipartimento di Fisica e Astronomia, Università di Bologna, Italy).
Webb studies moon-forming disc around massive planet CT Cha B
The disc offers insight into how the moons of solar system gas giants like Jupiter might have formed.
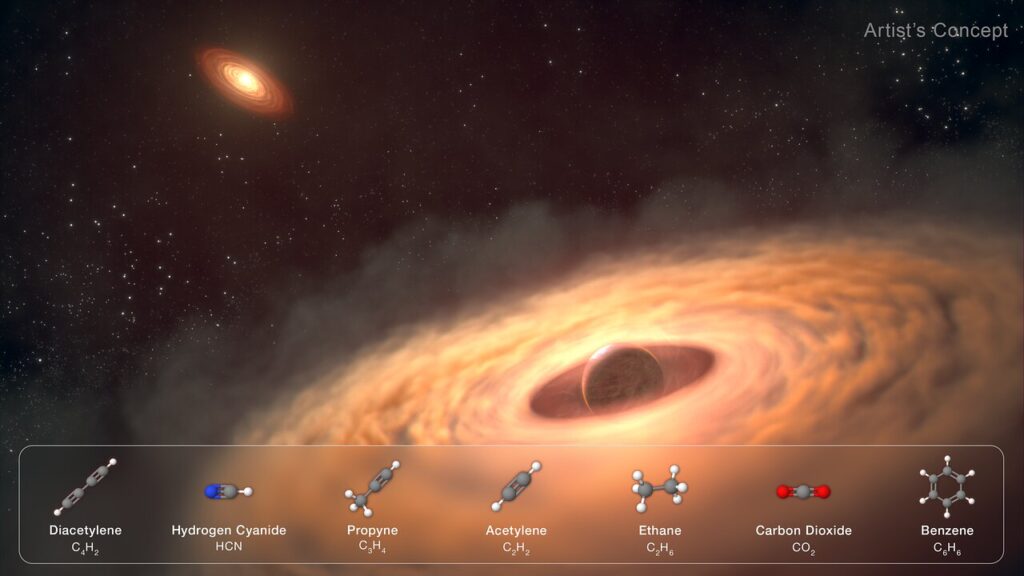
The NASA/ESA/CSA James Webb Space Telescope has provided the first direct measurements of the chemical and physical properties of a potential moon-forming disc encircling a large exoplanet. The carbon-rich disc surrounding the world called CT Cha B, which is located 625 light years away from Earth, is a possible construction yard for moons, although no moons are detected in the Webb data.
Our Solar System contains eight major planets, and more than 400 known moons orbiting six of these planets. Where did they all come from? There are multiple formation mechanisms. The case for large moons, like the four Galilean satellites around Jupiter, is that they condensed out of a dust and gas disc encircling the planet when it formed. But that would have happened over 4 billion years ago, and there is scant forensic evidence today.
Webb has now provided the first direct view of material in a disc around a large exoplanet. An international team of astronomers have uncovered a carbon-rich disc encircling the world called CT Cha b, which is located 625 light-years away from Earth.
The young star the planet orbits is only 2 million years old and still accreting circumstellar material. However, the circumplanetary disc discovered by Webb is not part of the larger accretion disc around the central star. The two objects are 74 billion kilometres apart.
Observing planet and moon formation is fundamental to understanding the evolution of planetary systems across our galaxy. Moons likely outnumber planets, and some might be habitats for life as we know it. But we are now only entering an era where we can witness their formation.
This discovery fosters a better understanding of planet and moon formation, say researchers. Webb’s data is invaluable for making comparisons to our Solar System’s birth over 4 billion years ago.
“We can see evidence of the disc around the companion, and we can study the chemistry for the first time. We’re not just witnessing moon formation – we’re also witnessing this planet’s formation,” said co-lead author Sierra Grant of the Carnegie Institution for Science in Washington, D.C., USA.
“We are seeing what material is accreting to build the planet and moons,” added main lead author Gabriele Cugno of the University of Zurich in Switzerland and member of the National Centre of Competence in Research PlanetS.
Dissecting starlight
Infrared observations of CT Cha b were made with Webb’s MIRI (Mid-Infrared Instrument) using its medium resolution spectrograph. An initial look into Webb’s archival data revealed signs of molecules within the circumplanetary disc, which motivated a deeper dive into the data. Because the planet’s faint signal is buried in the glare of the host star, the researchers had to disentangle the light of the star from the planet using high-contrast methods.
“We saw molecules at the location of the planet, and so we knew that there was stuff in there worth digging for and spending a year trying to tease out of the data. It really took a lot of perseverance,” said Grant.
Ultimately, the team discovered seven carbon-bearing molecules within the planet’s disc, including acetylene (C2H2) and benzene (C6H6). This carbon-rich chemistry is in stark contrast to the chemistry seen in the disc around the host star, where the researchers found water but no carbon. The difference between the two discs offers evidence for their rapid chemical evolution over only 2 million years.
Genesis of moons
A circumplanetary disc of debris has long been hypothesized as the birthplace of Jupiter’s four major moons. These Galilean satellites must have condensed out of such a flattened disc billions of years ago, as evident in their co-planar orbits about Jupiter. The two outermost Galilean moons, Ganymede and Callisto, are 50% water ice. But they presumably have rocky cores, perhaps made of carbon or silicon.
“We want to learn more about how our Solar System formed moons. This means that we need to look at other systems that are still under construction. We’re trying to understand how it all works,” said Cugno. “How do these moons come to be? What are the ingredients? What physical processes are at play, and over what timescales? Webb allows us to witness the drama of moon formation and investigate these questions observationally for the first time.”
In the coming year, the team will use Webb to perform a comprehensive survey of similar objects to better understand the diversity of physical and chemical properties in the discs around young planets.
The James Webb Space Telescope studies the potential moon-forming disc around the massive exoplanet CT Cha B. An artistic rendering of a dust and gas disc encircling the young exoplanet, CT Cha b, 625 light-years from Earth. Spectroscopic data from the NASA/ESA/CSA James Webb Space Telescope suggest the disc contains the raw materials for moon formation. The planet appears at lower right, while its host star and surrounding protoplanetary disc are visible in the background. Credit: NASA, ESA, CSA, STScI, G. Cugno (University of Zürich, NCCR PlanetS), S. Grant (Carnegie Institution for Science), J, Olmsted (STScI), L. Hustak (STScI)
Bibliographic information:
Gabriele Cugno and Sierra L. Grant 2025, ApJL991 L46, DOI: 10.3847/2041-8213/ae0290
Webb finds new evidence for planet, a gas giant orbiting Alpha Centauri A, our closest solar twin
Astronomers using the NASA/ESA/CSA James Webb Space Telescope have found strong evidence of a giant planet orbiting a star in the stellar system closest to our own Sun. At just 4 light-years away from Earth, the Alpha Centauri triple star system has long been a compelling target in the search for worlds beyond our solar system.
This artist’s concept shows what the gas giant orbiting Alpha Centauri A could look like. Observations of the triple star system Alpha Centauri using the NASA/ESA/CSA James Webb Space Telescope indicate the potential gas giant, about the mass of Saturn, orbiting the star by about two times the distance between the Sun and Earth. In this concept, Alpha Centauri A is depicted at the upper left of the planet, while the other Sun-like star in the system, Alpha Centauri B, is at the upper right. Our Sun is shown as a small dot of light between those two stars. Credit: NASA, ESA, CSA, STScI, R. Hurt (Caltech/IPAC)
Visible only from Earth’s Southern hemisphere, it’s made up of the binary Alpha Centauri A and Alpha Centauri B, both Sun-like stars, and the faint red dwarf star Proxima Centauri. Alpha Centauri A is the third brightest star in the night sky. While there are three confirmed planets orbiting Proxima Centauri, the presence of other worlds surrounding Alpha Centauri A and Alpha Centauri B has proved challenging to confirm.
Now, Webb’s observations from its Mid-Infrared Instrument (MIRI) are providing the strongest evidence to date of a gas giant orbiting Alpha Centauri A. The results have been accepted in a series of two papers in The Astrophysical Journal Letters.
This image shows the Alpha Centauri star system from several different ground- and space-based observatories: the Digitized Sky Survey (DSS), the NASA/ESA Hubble Space Telescope, and the NASA/ESA/CSA James Webb Space Telescope. Alpha Centauri A is the third brightest star in the night sky, and the closest Sun-like star to Earth. The ground-based image from DSS shows the triple system as a single source of light, while Hubble resolves the two Sun-like stars in the system, Alpha Centauri A and Alpha Centauri B. The image from Webb’s MIRI (Mid-Infrared Instrument), which uses a coronagraphic mask to block the bright glare from Alpha Centauri A, reveals a potential planet orbiting the star. Credit: NASA, ESA, CSA, STScI, DSS, A. Sanghi (Caltech), C. Beichman (JPL), D. Mawet (Caltech), J. DePasquale (STScI)
If confirmed, the planet would be the closest to Earth that orbits in the habitable zone of a Sun-like star. However, because the planet candidate is a gas giant, scientists say it would not support life as we know it.
“With this system being so close to us, any exoplanets found would offer our best opportunity to collect data on planetary systems other than our own. Yet, these are incredibly challenging observations to make, even with the world’s most powerful space telescope, because these stars are so bright, close, and move across the sky quickly,” said Charles Beichman, NASA’s Jet Propulsion Laboratory and the NASA Exoplanet Science Institute at Caltech’s IPAC astronomy center, co-first author on the new papers. “Webb was designed and optimized to find the most distant galaxies in the universe. The operations team at the Space Telescope Science Institute had to come up with a custom observing sequence just for this target, and their extra effort paid off spectacularly.”
Several rounds of meticulously planned observations by Webb, careful analysis by the research team, and extensive computer modeling helped determine that the source seen in Webb’s image is likely to be a planet, and not a background object (like a galaxy), foreground object (a passing asteroid), or other detector or image artifact.
The first observations of the system took place in August 2024, using the coronagraphic mask aboard MIRI to block Alpha Centauri A’s light. While extra brightness from the nearby companion star Alpha Centauri B complicated the analysis, the team was able to subtract out the light from both stars to reveal an object over 10,000 times fainter than Alpha Centauri A, separated from the star by about two times the distance between the Sun and Earth.
While the initial detection was exciting, the research team needed more data to come to a firm conclusion. However, additional observations of the system in February 2025 and April 2025 (using Director’s Discretionary Time) did not reveal any objects like the one identified in August 2024.
“We are faced with the case of a disappearing planet! To investigate this mystery, we used computer models to simulate millions of potential orbits, incorporating the knowledge gained when we saw the planet, as well as when we did not,” said PhD student Aniket Sanghi of the California Institute of Technology in Pasadena, California. Sanghi is a co-first author on the two papers covering the team’s research.
This 3-panel image captures the NASA/ESA/CSA James Webb Space Telescope’s observational search for a planet around the nearest Sun-like star, Alpha Centauri A. The initial image shows the bright glare of Alpha Centauri A and Alpha Centauri B, then the middle panel shows the system with a coronagraphic mask placed over Alpha Centauri A to block its bright glare. However, the way the light bends around the edges of the coronagraph creates ripples of light in the surrounding space. The telescope’s optics (its mirrors and support structures) cause some light to interfere with itself, producing circular and spoke-like patterns. These complex light patterns, along with light from the nearby Alpha Centauri B, make it incredibly difficult to spot faint planets. In the panel at the right, astronomers have subtracted the known patterns (using reference images and algorithms) to clean up the image and reveal faint sources like the candidate planet. Credit: NASA, ESA, CSA, STScI, A. Sanghi (Caltech), C. Beichman (JPL), D. Mawet (Caltech), J. DePasquale (STScI)
Researchers say a non-detection in the second and third round of observations with Webb isn’t surprising.
“We found that in half of the possible orbits simulated, the planet moved too close to the star and wouldn’t have been visible to Webb in both February and April 2025,” said Sanghi.
Based on the brightness of the planet in the mid-infrared observations and the orbit simulations, researchers say it could be a gas giant approximately the mass of Saturn orbiting Alpha Centauri A in an elliptical path varying between 1 to 2 times the distance between Sun and Earth.
“These are some of the most demanding observations we’ve done so far with MIRI’s coronagraph,” said Pierre-Olivier Lagage, of CEA, France, who is a co-author on the papers and was the French lead for the development of MIRI. “When we were developing the instrument we were eager to see what we might find around Alpha Centauri, and I’m looking forward to what it will reveal to us next!”
“If confirmed, the potential planet seen in the Webb image of Alpha Centauri A would mark a new milestone for exoplanet imaging efforts,” Sanghi says. “Of all the directly imaged planets, this would be the closest to its star seen so far. It’s also the most similar in temperature and age to the giant planets in our solar system, and nearest to our home, Earth,” he says. “Its very existence in a system of two closely separated stars would challenge our understanding of how planets form, survive, and evolve in chaotic environments.”
If confirmed by additional observations, the team’s results could transform the future of exoplanet science.
“This would become a touchstone object for exoplanet science, with multiple opportunities for detailed characterization by Webb and other observatories,” said Beichman.
Hubble makes size estimate of interstellar comet 3I/ATLAS
A team of astronomers has taken the sharpest-ever picture of the unexpected interstellar comet 3I/ATLAS, using the crisp vision of the NASA/ESA Hubble Space Telescope.
This image of interstellar comet 3I/ATLAS was captured by the Hubble Space Telescope’s Wide Field Camera on 21 July 2025. The scale bar is labeled in arcseconds, which is a measure of angular distance on the sky. One arcsecond is equal to an angular measurement of 1/3600 of one degree. There are 60 arcminutes in a degree and 60 arcseconds in an arcminute (the full Moon has an angular diameter of about 30 arcminutes). The actual size of an object that covers one arcsecond on the sky depends on its distance from the telescope. The north and east compass arrows show the orientation of the image on the sky. Note that the relationship between north and east on the sky (as seen from below) is flipped relative to direction arrows on a map of the ground (as seen from above). This image shows visible wavelengths of light. Credit: NASA, ESA, D. Jewitt (UCLA); Image Processing: J. DePasquale (STScI)
Hubble’s observations are allowing astronomers to more accurately estimate the size of the comet’s solid icy nucleus. The upper limit on the diameter of the nucleus is 5.6 kilometers, though it could be as small as 320 metres across, researchers report. Though the Hubble images put tighter constraints on the nucleus size compared to previous ground-based estimates, the solid heart of the comet presently cannot be directly seen, even by Hubble. Observations from other observatories, including the NASA/ESA/CSA James Webb Space Telescope, will help refine our knowledge about the comet, including its chemical makeup.
Hubble also captured a dust plume ejected from the Sun-warmed side of the comet, and the hint of a dust tail streaming away from the nucleus. Hubble’s data yields a dust-loss rate consistent with comets that are first detected around 480 million kilometres from the Sun. This behaviour is much like the signature of previously seen Sun-bound comets originating within our Solar System.
The big difference is that this interstellar visitor originated in some other Solar System elsewhere in our Milky Way galaxy.
3I/ATLAS is traveling through our Solar System at roughly 210,000 kilometres per hour, the highest velocity ever recorded for a Solar System visitor. This breathtaking sprint is evidence that the comet has been drifting through interstellar space for many billions of years. The gravitational slingshot effect from innumerable stars and nebulae the comet passed added momentum, ratcheting up its speed. The longer 3I/ATLAS was out in space, the higher its speed grew.
This comet was discovered by the Asteroid Terrestrial-impact Last Alert System (ATLAS) on 1 July 2025 at a distance of 675 million kilometres from the Sun. 3I/ATLAS should remain visible to ground-based telescopes through September, after which it will pass too close to the Sun to observe and is expected to reappear on the other side of the Sun by early December.
The paper will be published in The Astrophysical Journal Letters. It is already available here.
This is a Hubble Space telescope image of the interstellar comet 3I/ATLAS. Hubble photographed the comet on 21 July 21 2025, when the comet was 365 million kilometres from Earth. Hubble shows that the comet has a teardrop-shaped cocoon of dust coming off its solid, icy nucleus. Because Hubble was tracking the comet moving along a hyperbolic trajectory, the stationary background stars are streaked in the exposure. Credit: NASA, ESA, D. Jewitt (UCLA); Image Processing: J. DePasquale (STScI)
Astronomers witness still-forming planet sculpting the dust around it, near the star HD 135344B
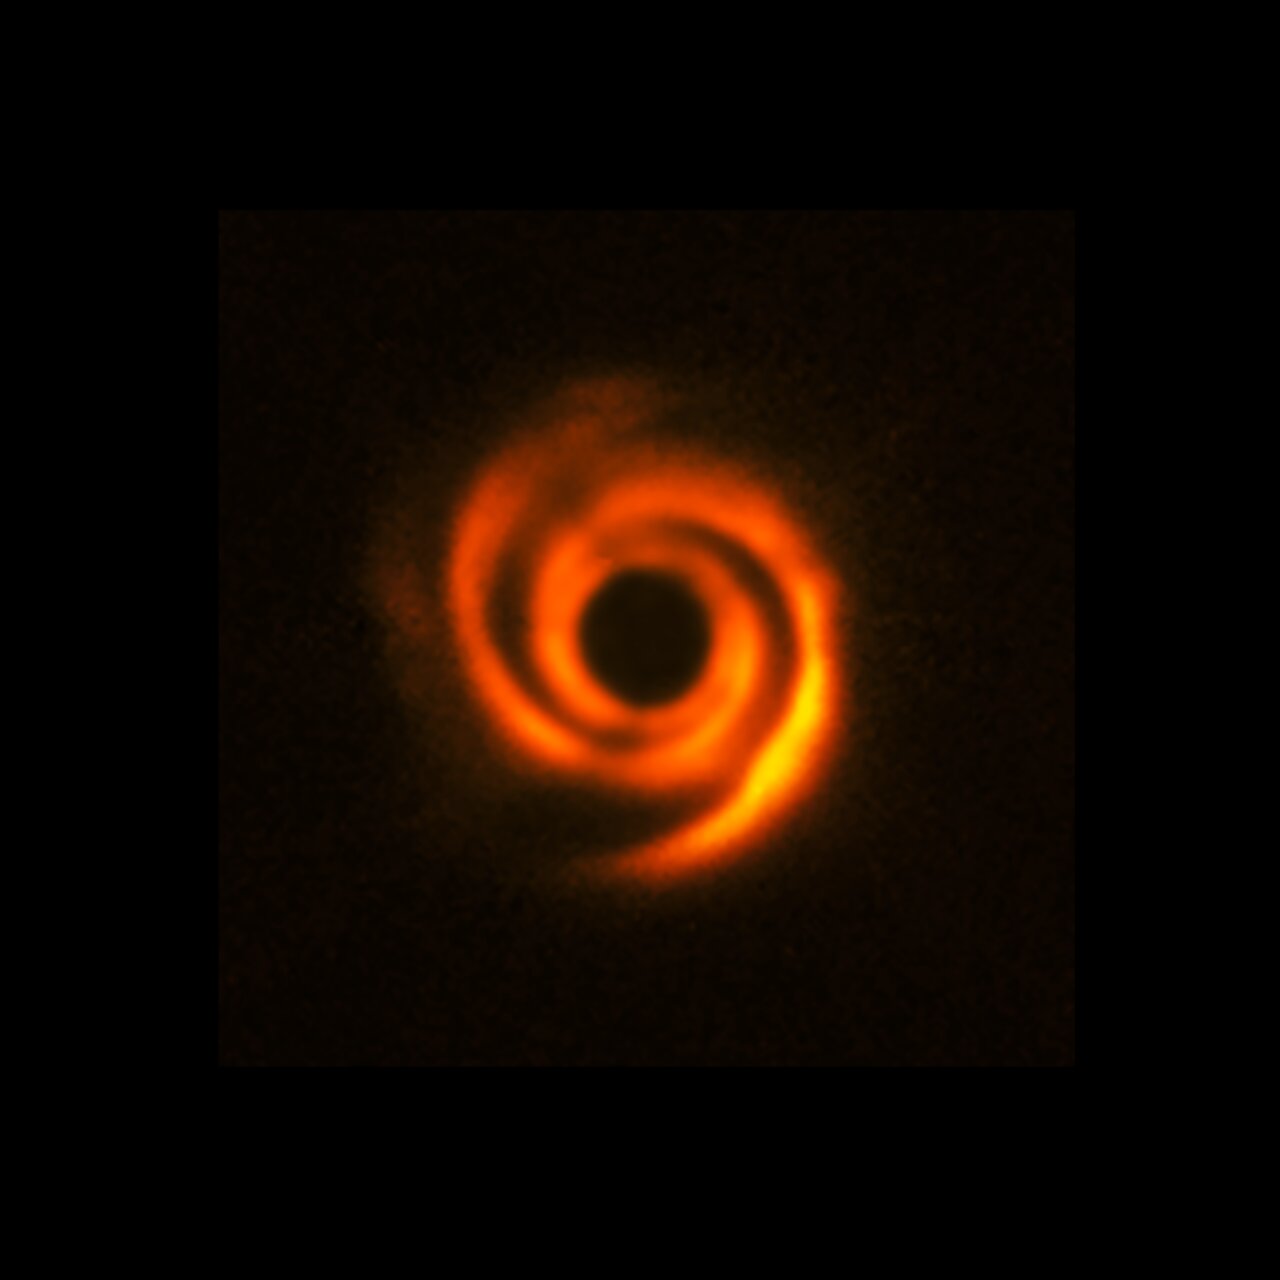
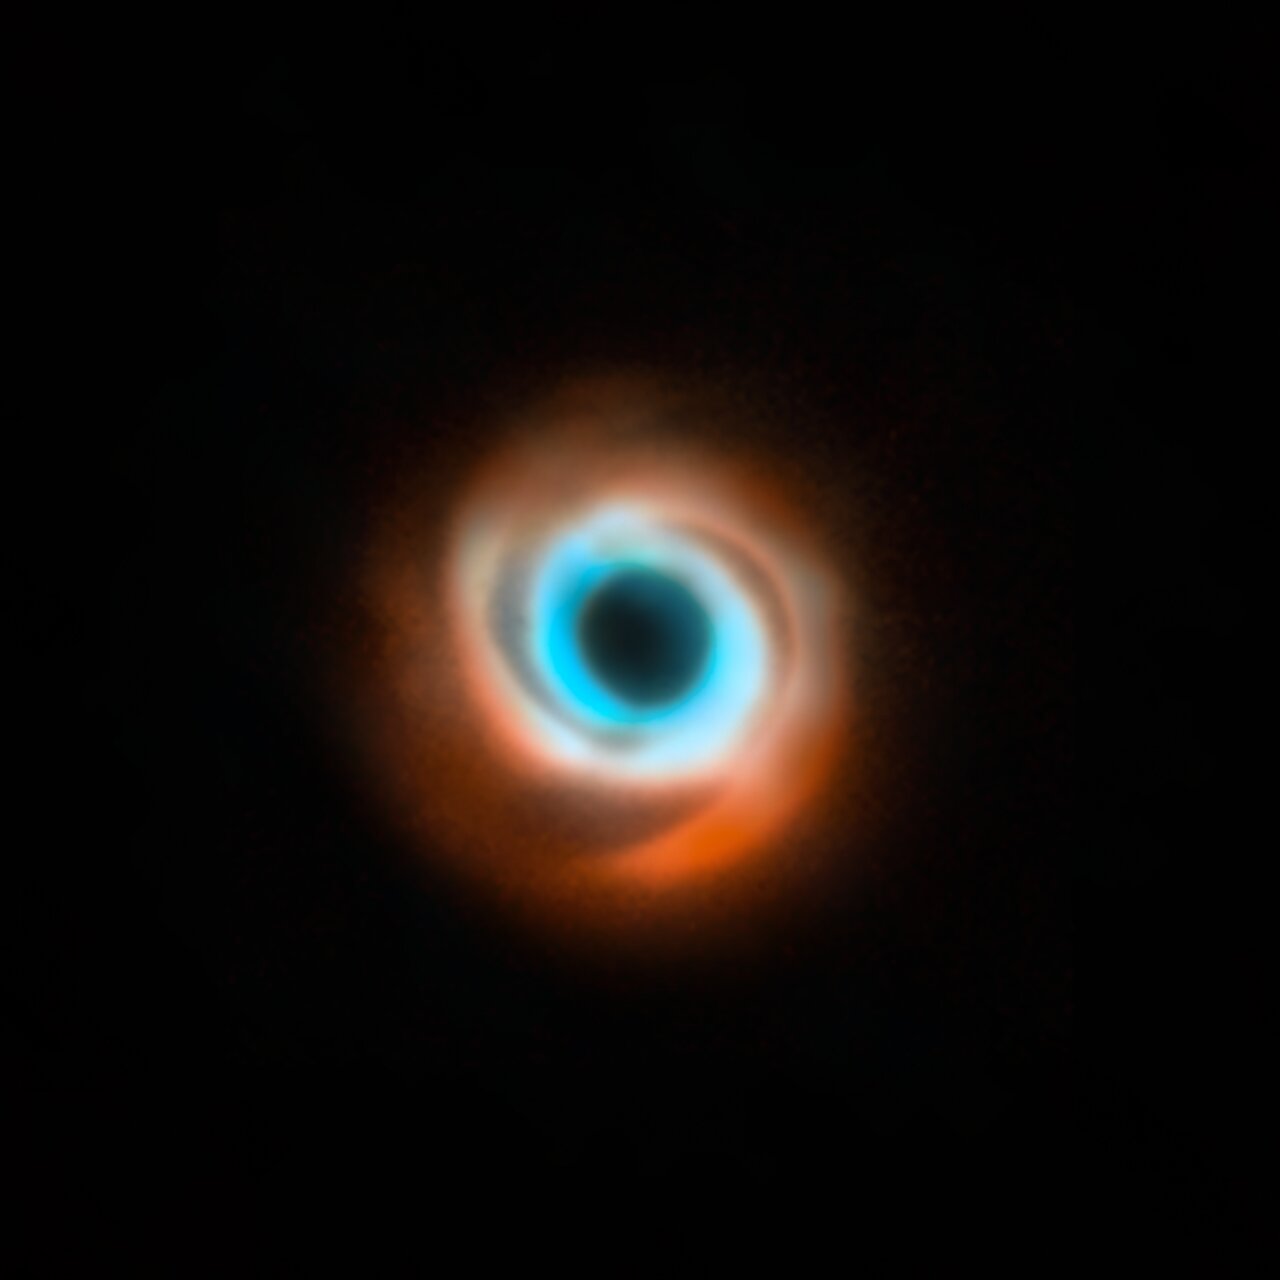
The image to the left, taken with ESO’s Very Large Telescope (VLT), shows a possible planet being born around the young star HD 135344B. This star, located around 440 light-years away, is surrounded by a disc of dust and gas with prominent spiral arms. Theory predicts that planets can sculpt spiral arms like these, and the new planet candidate is located at the base of one of the arms, just as expected. The image was captured with a new VLT instrument: the Enhanced Resolution Imager and Spectrograph (ERIS). The central black circle corresponds to a coronagraph –– a device that blocks the light of the star to reveal faint details around it. The white circle indicates the location of the planet. The image to the right is a combination of previous observations taken with the SPHERE instrument also at the VLT (red) and the Atacama Large Millimeter/submillimeter Array (ALMA, orange and blue). These and other previous studies of HD 135344B did not find signatures of a companion, but ERIS may have finally unveiled the culprit responsible for the star’s spiral disc. Credit: ESO/F. Maio et al./T. Stolker et al./ ALMA (ESO/NAOJ/NRAO)/N. van der Marel et al.
Astronomers may have caught a still-forming planet in action, carving out an intricate pattern in the gas and dust that surrounds its young host star. Using ESO’s Very Large Telescope (VLT), they observed a planetary disc with prominent spiral arms, finding clear signs of a planet nestled in its inner regions. This is the first time astronomers have detected a planet candidate embedded inside a disc spiral.
“We will never witness the formation of Earth, but here, around a young star 440 light-years away, we may be watching a planet come into existence in real time,” says Francesco Maio, a doctoral researcher at the University of Florence, Italy, and lead author of this study, published today in Astronomy & Astrophysics.
The potential planet-in-the-making was detected around the star HD 135344B, within a disc of gas and dust around it called a protoplanetary disc. The budding planet is estimated to be twice the size of Jupiter and as far from its host star as Neptune is from the Sun. It has been observed shaping its surroundings within the protoplanetary disc as it grows into a fully formed planet.
This image, taken with ESO’s Very Large Telescope (VLT), shows a spiral disc around the young star HD 135344B. The image was obtained with the VLT’s Enhanced Resolution Imager and Spectrograph (ERIS) instrument, which found a candidate planet that may be sculpting the spiral features in the disc. The location of this planet is indicated with a white circle. The central black circle corresponds to a coronagraph — a device that blocks the light of the star to reveal faint details around it. Credit: ESO/F. Maio et al.
Protoplanetary discs have been observed around other young stars, and they often display intricate patterns, such as rings, gaps or spirals. Astronomers have long predicted that these structures are caused by baby planets, which sweep up material as they orbit around their parent star. But, until now, they had not caught one of these planetary sculptors in the act.
This image, captured with ESO’s Very Large Telescope (VLT), shows a spiral disc around the young star HD 135344B. The image, which was released in 2016, was obtained with the Spectro-Polarimetric High-contrast Exoplanet Research (SPHERE) instrument.
Spiral features like these can be sculpted by planets, although this image doesn’t show evidence of companions orbiting HD 135344B. However, new observations at somewhat longer wavelengths, obtained with the Enhanced Resolution Imager and Spectrograph (ERIS) at the VLT, have found a possible young planet around this star.
The central black circle corresponds to a coronagraph –– a device that blocks the light of the star to reveal faint details around it.
Credit: ESO/T. Stolker et al.
This image, taken with the Atacama Large Millimeter/submillimeter Array (ALMA), and first released in 2015, shows a planet-forming disc around the young star HD 135344B. The image combines a view of both the gas (blue) and the dust (orange) around the star. The star itself is invisible at these wavelengths, and is located in the central gap of the disc.
Credit: ALMA (ESO/NAOJ/NRAO)/N. van der Marel et al.
This image shows the dusty disc around the young star HD 135344B. It’s a combination of data taken with two different facilities: the Spectro-Polarimetric High-contrast Exoplanet Research (SPHERE) instrument at ESO’s VLT in red, and the Atacama Large Millimeter/submillimeter Array (ALMA) in orange and blue. The original SPHERE and ALMA images were released in 2016 and 2015 respectively and didn’t show evidence for the presence of a planet in this disc, first revealed in 2025.
Credit: ESO/T. Stolker et al./ALMA (ESO/NAOJ/NRAO)/N. van der Marel et al.
This image from the Digitized Sky Survey (DSS) shows the region of the sky around the star HD 135344B. Right at the centre of the image there are two bright stars close to each other; HD 135344B is the one at the bottom.
Credit: ESO/Digitized Sky Survey 2. Acknowledgement: D. De Martin
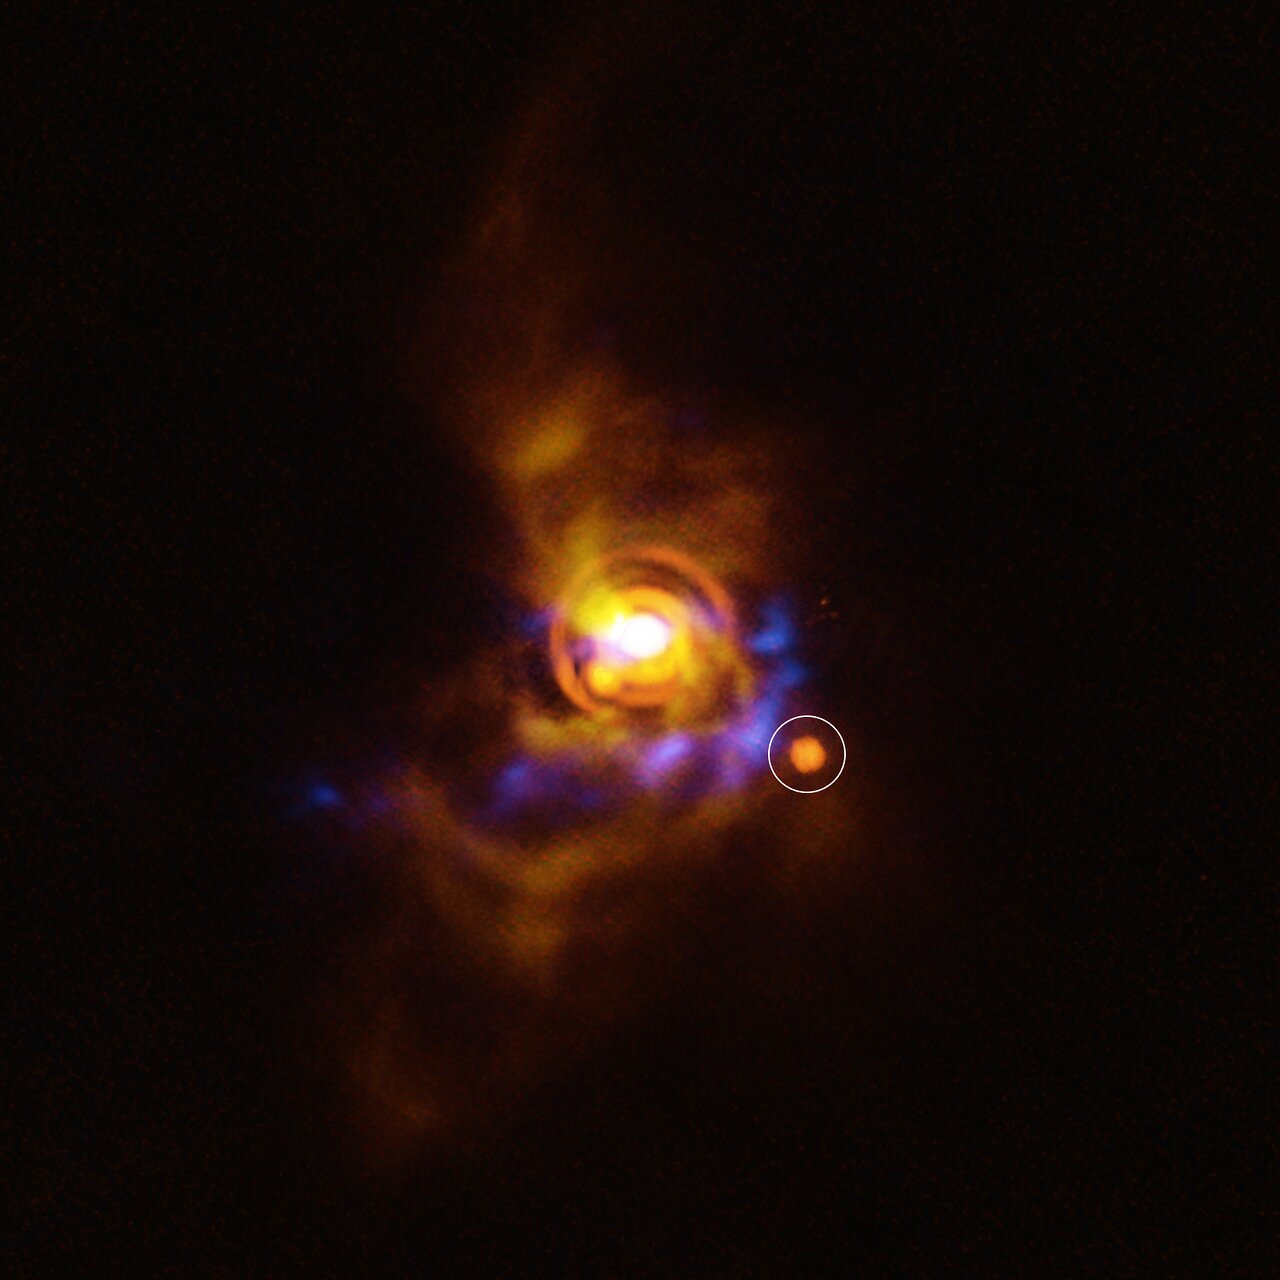
This image shows a possible companion orbiting the young star V960 Mon. The star, located more than 5000 light-years away, is surrounded by a disc with intricate features. Previous analysis of the disc showed that it contains clumps of unstable material that could collapse to form a companion object. The new candidate found here could be either a planet or a brown dwarf –– an object bigger than a planet that didn’t gain enough mass to shine as a star.
The candidate object was found with ESO’s Very Large Telescope (VLT), using its new Enhanced Resolution Imager and Spectrograph (ERIS). The new ERIS data are shown here in orange, overlaid on older images of the dusty disc as seen with the VLT’s SPHERE instrument (yellow) and the Atacama Large Millimeter/submillimeter Array (ALMA, in blue).
Credit: ESO/A. Dasgupta/ALMA (ESO/NAOJ/NRAO)/Weber et al.
This image, taken with ESO’s Very Large Telescope (VLT), shows a possible companion orbiting the young star V960 Mon. The image was captured with the VLT’s Enhanced Resolution Imager and Spectrograph (ERIS) instrument. The properties of the object are unknown: it could be a planet or a brown dwarf –– an object bigger than a planet that didn’t gain enough mass to shine as a star.
Credit: ESO/A. Dasgupta
In the case of HD 135344B’s disc, swirling spiral arms had previously been detected by another team of astronomers using SPHERE (Spectro-Polarimetric High-contrast Exoplanet REsearch), an instrument on ESO’s VLT. However, none of the previous observations of this system found proof of a planet forming within the disc.
Now, with observations from the new VLT’s Enhanced Resolution Imager and Spectrograph (ERIS) instrument, the researchers say they may have found their prime suspect. The team spotted the planet candidate right at the base of one of the disc’s spiral arms, exactly where theory had predicted they might find the planet responsible for carving such a pattern.
“What makes this detection potentially a turning point is that, unlike many previous observations, we are able to directly detect the signal of the protoplanet, which is still highly embedded in the disc,” says Maio, who is based at the Arcetri Astrophysical Observatory, a centre of Italy’s National Institute for Astrophysics (INAF). “This gives us a much higher level of confidence in the planet’s existence, as we’re observing the planet’s own light.”
A star’s companion is born
A different team of astronomers have also recently used the ERIS instrument to observe another star, V960 Mon, one that is still in the very early stages of its life. In a study published on 18 July in The Astrophysical Journal Letters, the team report that they have found a companion object to this young star. The exact nature of this object remains a mystery.
This image shows a possible companion orbiting the young star V960 Mon. The star, located more than 5000 light-years away, is surrounded by a disc with intricate features. Previous analysis of the disc showed that it contains clumps of unstable material that could collapse to form a companion object. The new candidate found here could be either a planet or a brown dwarf –– an object bigger than a planet that didn’t gain enough mass to shine as a star.
The candidate object was found with ESO’s Very Large Telescope (VLT), using its new Enhanced Resolution Imager and Spectrograph (ERIS). The new ERIS data are shown here in orange, overlaid on older images of the dusty disc as seen with the VLT’s SPHERE instrument (yellow) and the Atacama Large Millimeter/submillimeter Array (ALMA, in blue).
Credit: ESO/A. Dasgupta/ALMA (ESO/NAOJ/NRAO)/Weber et al.
This image, taken with ESO’s Very Large Telescope (VLT), shows a possible companion orbiting the young star V960 Mon. The image was captured with the VLT’s Enhanced Resolution Imager and Spectrograph (ERIS) instrument. The properties of the object are unknown: it could be a planet or a brown dwarf –– an object bigger than a planet that didn’t gain enough mass to shine as a star.
Credit: ESO/A. Dasgupta
The new study, led by Anuroop Dasgupta, a doctoral researcher at ESO and at the Diego Portales University in Chile, follows up observations of V960 Mon made a couple of years ago. Those observations, made with both SPHERE and the Atacama Large Millimeter/submillimeter Array (ALMA), revealed that the material orbiting V960 Mon is shaped into a series of intricate spiral arms. They also showed that the material is fragmenting, in a process known as ‘gravitational instability’, when large clumps of the material around a star contract and collapse, each with the potential to form a planet or a larger object.
“That work revealed unstable material but left open the question of what happens next. With ERIS, we set out to find any compact, luminous fragments signalling the presence of a companion in the disc — and we did,” says Dasgupta.
The team found a potential companion object very near to one of the spiral arms observed with SPHERE and ALMA. The team say that this object could either be a planet in formation, or a ‘brown dwarf’ — an object bigger than a planet that didn’t gain enough mass to shine as a star.
If confirmed, this companion object may be the first clear detection of a planet or brown dwarf forming by gravitational instability.
More information
This research highlighted in the first part of this release was presented in the paper “Unveiling a protoplanet candidate embedded in the HD 135344B disk with VLT/ERIS” to appear in Astronomy & Astrophysics (doi: 10.1051/0004-6361/202554472). The second part of the release highlights the study “VLT/ERIS observations of the V960 Mon system: a dust-embedded substellar object formed by gravitational instability?” published in The Astrophysical Journal Letters (doi: 10.3847/2041-8213/ade996).
The team who conducted the first study (on HD 135344B) is composed of F. Maio (University of Firenze, Italy, and INAF-Osservatorio Astrofisico Arcetri, Firenze, Italy [OAA]), D. Fedele (OAA), V. Roccatagliata (University of Bologna, Italy [UBologna] and OAA), S. Facchini (University of Milan, Italy [UNIMI]), G. Lodato (UNIMI), S. Desidera (INAF-Osservatorio Astronomico di Padova, Italy [OAP]), A. Garufi (INAF – Istituto di Radioastronomia, Bologna, Italy [INAP-Bologna], and Max-Planck-Institut für Astronomie, Heidelberg, Germany [MPA]), D. Mesa (OAP), A. Ruzza (UNIMI), C. Toci (European Southern Observatory [ESO], Garching bei Munchen, Germany, and OAA), L. Testi (OAA, and UBologna), A. Zurlo (Diego Portales University [UDP], Santiago, Chile, and Millennium Nucleus on Young Exoplanets and their Moons [YEMS], Santiago, Chile), and G. Rosotti (UNIMI).
The team behind the second study (on V960 Mon) is primarily composed of members of the Millennium Nucleus on Young Exoplanets and their Moons (YEMS), a collaborative research initiative based in Chile. Core YEMS contributors include A. Dasgupta (ESO, Santiago, Chile, UDP, and YEMS), A. Zurlo (UDP and YEMS), P. Weber (University of Santiago [Usach], Chile, and YEMS, and Center for Interdisciplinary Research in Astrophysics and Space Exploration [CIRAS], Santiago, Chile), F. Maio (OAA, and University of Firenze, Italy), Lucas A. Cieza (UDP and YEMS), D. Fedele (OAA), A. Garufi (INAF Bologna and MPA), J. Miley (Usach, YEMS, and CIRAS), P. Pathak (Indian Institute of Technology, Kanpur, India), S. Pérez (Usach and YEMS, and CIRAS), and V. Roccatagliata (UBologna and OAA).
The Atacama Large Millimeter/submillimeter Array (ALMA), an international astronomy facility, is a partnership of ESO, the U.S. National Science Foundation (NSF) and the National Institutes of Natural Sciences (NINS) of Japan in cooperation with the Republic of Chile. ALMA is funded by ESO on behalf of its Member States, by NSF in cooperation with the National Research Council of Canada (NRC) and the National Science and Technology Council (NSTC) in Taiwan and by NINS in cooperation with the Academia Sinica (AS) in Taiwan and the Korea Astronomy and Space Science Institute (KASI). ALMA construction and operations are led by ESO on behalf of its Member States; by the National Radio Astronomy Observatory (NRAO), managed by Associated Universities, Inc. (AUI), on behalf of North America; and by the National Astronomical Observatory of Japan (NAOJ) on behalf of East Asia. The Joint ALMA Observatory (JAO) provides the unified leadership and management of the construction, commissioning and operation of ALMA.
The European Southern Observatory (ESO) enables scientists worldwide to discover the secrets of the Universe for the benefit of all. We design, build and operate world-class observatories on the ground — which astronomers use to tackle exciting questions and spread the fascination of astronomy — and promote international collaboration for astronomy. Established as an intergovernmental organisation in 1962, today ESO is supported by 16 Member States (Austria, Belgium, Czechia, Denmark, France, Finland, Germany, Ireland, Italy, the Netherlands, Poland, Portugal, Spain, Sweden, Switzerland and the United Kingdom), along with the host state of Chile and with Australia as a Strategic Partner. ESO’s headquarters and its visitor centre and planetarium, the ESO Supernova, are located close to Munich in Germany, while the Chilean Atacama Desert, a marvellous place with unique conditions to observe the sky, hosts our telescopes. ESO operates three observing sites: La Silla, Paranal and Chajnantor. At Paranal, ESO operates the Very Large Telescope and its Very Large Telescope Interferometer, as well as survey telescopes such as VISTA. Also at Paranal ESO will host and operate the Cherenkov Telescope Array South, the world’s largest and most sensitive gamma-ray observatory. Together with international partners, ESO operates ALMA on Chajnantor, a facility that observes the skies in the millimetre and submillimetre range. At Cerro Armazones, near Paranal, we are building “the world’s biggest eye on the sky” — ESO’s Extremely Large Telescope. From our offices in Santiago, Chile we support our operations in the country and engage with Chilean partners and society.
Webb exposes complex atmosphere of SIMP 0136, a starless super-Jupiter
An international team of researchers has discovered that previously observed variations in brightness across a free-floating planetary-mass object known as SIMP 0136 must be the result of a complex combination of atmospheric factors, and cannot be explained by clouds alone.
Using the NASA/ESA/CSA James Webb Space Telescope to monitor a broad spectrum of infrared light emitted by SIMP 0136 over two full rotation periods, the team was able to detect variations in cloud layers, temperature, and carbon chemistry that were previously hidden from view. The results provide crucial insight into the three-dimensional complexity of gas giant atmospheres within and beyond our solar system.
Rapidly rotating, free-floating
SIMP 0136 is a rapidly rotating, free-floating object roughly 13 times the mass of Jupiter, located in the Milky Way just 20 light-years from Earth. Although it is not classified as a gas giant exoplanet — it doesn’t orbit a star and may instead be a brown dwarf — SIMP 0136 is an ideal target for exo-meteorology: It is the brightest object of its kind in the northern sky. Because it is isolated, it can be observed directly and with no fear of light contamination or variability caused by a host star. And its short rotation period of just 2.4 hours makes it possible to survey very efficiently.
Prior to the Webb observations, SIMP 0136 had been studied extensively using ground-based observatories, as well as and NASA’s Spitzer Space Telescope and the NASA/ESA Hubble Space Telescope.
“We already knew that it varies in brightness, and we were confident that there are patchy cloud layers that rotate in and out of view and evolve over time,” explained Allison McCarthy, doctoral student at Boston University and lead author on a study published today in The Astrophysical Journal Letters. “We also thought there could be temperature variations, chemical reactions, and possibly some effects of auroral activity affecting the brightness, but we weren’t sure.”
To figure it out, the team needed Webb’s ability to measure very precise changes in brightness over a broad range of wavelengths.
Charting thousands of infrared rainbows
Using NIRSpec (Near-Infrared Spectrograph), Webb captured thousands of individual 0.6- to 5.3-micron spectra — one every 1.8 seconds over more than three hours as the object completed one full rotation. This was immediately followed by an observation with MIRI (Mid-Infrared Instrument), which collected hundreds of measurements of 5- to 14-micron light — one every 19.2 seconds, over another rotation.
The result was hundreds of detailed light curves, each showing the change in brightness of a very precise wavelength (color) as different sides of the object rotated into view.
“To see the full spectrum of this object change over the course of minutes was incredible,” said principal investigator Johanna Vos, from Trinity College Dublin. “Until now, we only had a little slice of the near-infrared spectrum from Hubble, and a few brightness measurements from Spitzer.”
The team noticed almost immediately that there were several distinct light-curve shapes. At any given time, some wavelengths were growing brighter, while others were becoming dimmer or not changing much at all. A number of different factors must be affecting the brightness variations.
“Imagine watching Earth from far away. If you were to look at each color separately, you would see different patterns that tell you something about its surface and atmosphere, even if you couldn’t make out the individual features,” explained co-author Philip Muirhead, also from Boston University. “Blue would increase as oceans rotate into view. Changes in brown and green would tell you something about soil and vegetation.”
This artist’s concept shows what the isolated planetary-mass object SIMP 0136 could look like based on recent observations from the NASA/ESA/CSA James Webb Space Telescope. SIMP 0136 has a mass about 13 times that of Jupiter. Although it is thought to have the structure and composition of a gas giant, it is not technically classified as an exoplanet because it doesn’t orbit its own star. The colors shown in the illustration represent near-infrared light, which is invisible to human eyes. SIMP 0136 is relatively warm — about 825 degrees Celsius or 1,100 kelvins — but is not hot enough to give off enough visible light to see from Earth, and is not illuminated by a host star. The bluish glow near the poles represents auroral energy (light given off by electrons spiraling in a magnetic field) which has been detected at radio wavelengths. Researchers used NIRSpec (Near-infrared Spectrograph) and MIRI (Mid-Infrared Instrument) to monitor the brightness of SIMP 0136 over two full rotations in July 2023. By analyzing the change in brightness of different wavelengths over time, researchers were able to detect variability in cloud cover at different depths, temperature variations in the high atmosphere, and changes in carbon chemistry as different sides of the object rotated in and out of view. SIMP 0136 is located within the Milky Way, about 20 light-years from Earth, in the constellation Pisces. It is the brightest isolated planet or brown dwarf visible from the Northern Hemisphere, and is thought to be about 200 million years old. This illustration is based on spectroscopic observations. Webb has not captured a direct image of the object. Credit: NASA, ESA, CSA, J. Olmsted (STScI)
Patchy clouds, hot spots, and carbon chemistry
To figure out what could be causing the variability on SIMP 0136, the team used atmospheric models to show where in the atmosphere each wavelength of light was originating.
“Different wavelengths provide information about different depths in the atmosphere,” explained McCarthy. “We started to realize that the wavelengths that had the most similar light-curve shapes also probed the same depths, which reinforced this idea that they must be caused by the same mechanism.”
One group of wavelengths, for example, originates deep in the atmosphere where there could be patchy clouds made of iron particles. A second group comes from higher clouds thought to be made of tiny grains of silicate minerals. The variations in both of these light curves are related to patchiness of the cloud layers.
A third group of wavelengths originates at very high altitude, far above the clouds, and seems to track temperature. Bright “hot spots” could be related to auroras that were previously detected at radio wavelengths, or to upwelling of hot gas from deeper in the atmosphere.
Some of the light curves cannot be explained by either clouds or temperature, but instead show variations related to atmospheric carbon chemistry. There could be pockets of carbon monoxide and carbon dioxide rotating in and out of view, or chemical reactions causing the atmosphere to change.
“We haven’t really figured out the chemistry part of the puzzle yet,” said Vos. “But these results are really exciting because they are showing us that the abundances of molecules like methane and carbon dioxide could change from place to place and over time. If we are looking at an exoplanet and can get only one measurement, we need to consider that it might not be representative of the entire planet.”
This research was conducted as part of Webb’s General Observer (GO) Program 3548.
These light curves show the change in brightness of three different sets of wavelengths (colors) of near-infrared light coming from the isolated planetary-mass object SIMP 0136 as it rotated. The light was captured by Webb’s NIRSpec (Near-Infrared Spectrograph), which collected a total of 5,726 spectra — one every 1.8 seconds — over the course of about 3 hours on 23 July 2023 (SIMP 0136 completes one rotation every 2.4 hours). By comparing these light curves to models, researchers were able to show that each set of wavelengths probes different depths (pressures) in the atmosphere. The curve shown in red tracks the brightness of 0.9- to 1.4-micron light thought to originate deep in the atmosphere at a pressure of about 10 bars (about 10 times the air pressure at sea level on Earth), within clouds made of iron particles. The curve shown in yellow tracks the brightness of 1.4- to 2.3-micron light from a pressure of about 1 bar within higher clouds made of tiny grains of silicate minerals. The variations in brightness shown by these two curves is related to patchiness of the cloud layers, which emit some wavelengths of light and absorb others. The curve shown in blue tracks the brightness of 3.3- to 3.6-micron light that originates high above the clouds at a pressure of about 0.1 bars. Changes in brightness of these wavelengths are related to variations in temperature around the object. Bright “hot spots” could be related to auroras that have been detected at radio wavelengths, or to upwelling of hot gas from deeper in the atmosphere. The differences in shape of these three light curves show that there are complex variations in SIMP 0136’s atmosphere with depth as well as longitude. If the atmosphere varied around the object in the same way at all depths, the light curves would have similar patterns. If it varied with depth, but not longitude, the light curves would be straight, flat lines. Note this graph shows the relative change in brightness for each given set of wavelengths over time, not the difference in absolute brightness between the different sets. At any given time, there is more light coming from the deep atmosphere (red light curve) than from the upper atmosphere (blue light curve). SIMP 0136 is located within the Milky Way, about 20 light-years from Earth, in the constellation Pisces. It is the brightest isolated planet or brown dwarf visible from the Northern Hemisphere, and is thought to be about 200 million years old. The artist’s concepts are based on spectroscopic observations. Webb has not captured a direct image of the object. Credit: NASA, ESA, CSA, J. Olmsted (STScI)
Hubble finds more black holes than expected in the early Universe
With the help of the NASA/ESA Hubble Space Telescope, an international team of researchers led by scientists in the Department of Astronomy at Stockholm University has found more black holes in the early Universe than has previously been reported. The new result can help scientists understand how supermassive black holes were created.
This is a new image of the Hubble Ultra Deep Field. The first deep imaging of the field was done with Hubble in 2004. The same survey field was observed again by Hubble several years later, and was then reimaged in 2023. By comparing Hubble Wide Field Camera 3 near-infrared exposures taken in 2009, 2012, and 2023, astronomers found evidence for flickering supermassive black holes in the hearts of early galaxies. One example is seen as a bright object in the inset. Some supermassive black holes do not swallow surrounding material constantly, but in fits and bursts, making their brightness flicker. This can be detected by comparing Hubble Ultra Deep Field frames taken at different epochs. The survey found more black holes than predicted. The image was created from Hubble data from the following proposals: 9978, 10086 (S. Beckwith); 11563 (G. Illingworth); 12498 (R. Ellis); and 17073 (M. Hayes). These images are composites of separate exposures acquired by the ACS and WFC3 instruments on the Hubble Space Telescope. Credit: NASA, ESA, M. Hayes (Stockholm University), J. DePasquale (STScI)
Scientists do not currently have a complete picture of how the first black holes formed, not long after the Big Bang. It is known that supermassive black holes, that can weigh more than a billion suns, exist at the centre of several galaxies less than a billion years after the Big Bang.
“Many of these objects seem to be more massive than we originally thought they could be at such early times — either they formed very massive or they grew extremely quickly,” said Alice Young, a PhD student from Stockholm University and co-author of the study published in The Astrophysical Journal Letters.
Black holes play an important role in the lifecycle of all galaxies, but there are major uncertainties in our understanding of how galaxies evolve. In order to gain a complete picture of the link between galaxy and black hole evolution, the researchers used Hubble to survey how many black holes exist among a population of faint galaxies when the Universe was just a few percent of its current age.
Initial observations of the survey region were re-photographed by Hubble several years later. This allowed the team to measure variations in the brightness of the galaxies. These variations are a tell-tale sign of black holes. The team identified more black holes than previously found by other methods.
The new observational results suggest that some black holes likely formed by the collapse of massive, pristine stars during the first billion years of cosmic time. These types of stars can only exist at very early times in the Universe, because later generations of stars are polluted by the remnants of stars that have already lived and died. Other alternatives for black hole formation include collapsing gas clouds, mergers of stars in massive clusters, and ‘primordial’ black holes that formed (by physically speculative mechanisms) in the first few seconds after the Big Bang. With this new information about black hole formation, more accurate models of galaxy formation can be constructed.
“The formation mechanism of early black holes is an important part of the puzzle of galaxy evolution,” said Matthew Hayes from the Department of Astronomy at Stockholm University and lead author of the study. “Together with models for how black holes grow, galaxy evolution calculations can now be placed on a more physically motivated footing, with an accurate scheme for how black holes came into existence from collapsing massive stars.”
Astronomers are also making observations with the NASA/ESA/CSA James Webb Space Telescope to search for galactic black holes that formed soon after the Big Bang, to understand how massive they were and where they were located.
This is an image of the Hubble Ultra Deep Field, taken in 2004. By comparing exposures taken in later years, astronomers found evidence for flickering supermassive black holes in the hearts of early galaxies. One example is seen as a bright object in the inset. Some supermassive black holes do not swallow surrounding material constantly, but in fits and starts, making their brightness flicker. This can be detected by comparing Hubble Ultra Deep Field frames taken at different epochs. The survey found more black holes than predicted. The image was created from Hubble data from the following proposals: 9978, 10086 (S. Beckwith); 11563 (G. Illingworth); 12498 (R. Ellis); and 17073 (M. Hayes). These images are composites of separate exposures acquired by the ACS and WFC3 instruments on the Hubble Space Telescope. Credit: NASA, ESA, M. Hayes (Stockholm University), J. DePasquale (STScI)
Investigating the origins of the Crab Nebula with Webb
New data revise our view of this unusual supernova explosion.
The Crab Nebula is a nearby example of the debris left behind when a star undergoes a violent death in a supernova explosion. However, despite decades of study, this supernova remnant continues to maintain a degree of mystery: what type of star was responsible for the creation of the Crab Nebula, and what was the nature of the explosion? The NASA/ESA/CSA James Webb Space Telescope has provided a new view of the Crab, including the highest-quality infrared data yet available to aid scientists as they explore the detailed structure and chemical composition of the remnant. These clues are helping to unravel the unusual way that the star exploded about 1000 years ago.
Image of the Crab Nebula captured by Webb’s NIRCam and MIRI, with compass arrows, scale bar, and colour key for reference. The north and east compass arrows show the orientation of the image on the sky. Note that the relationship between north and east on the sky (as seen from below) is flipped relative to direction arrows on a map of the ground (as seen from above). The scale bar is labelled in light-years, which is the distance that light travels in one Earth-year. (It takes two years for light to travel a distance equal to the length of the bar.) One light-year is equal to about 9.46 trillion kilometres or 5.88 trillion miles. The field of view shown in this image is approximately 10 light-years across. This image shows invisible near-infrared and mid-infrared wavelengths of light that have been translated into visible-light colours. The colour key shows which components were observed by NIRCam and MIRI, and which visible-light colour is assigned to each feature. Credit: NASA, ESA, CSA, STScI, T. Temim (Princeton University)
A team of scientists used the NASA/ESA/CSA James Webb Space Telescope to parse the composition of the Crab Nebula, a supernova remnant located 6500 light-years away in the constellation Taurus. With the telescope’s MIRI (Mid-Infared Instrument) and NIRCam (Near-Infrared Camera), the team gathered data that are helping to clarify the Crab Nebula’s history.
The Crab Nebula is the result of a core-collapse supernova that was the death of a massive star. The supernova explosion itself was seen on Earth in 1054 CE and was bright enough to view during the daytime. The much fainter remnant observed today is an expanding shell of gas and dust, and an outflowing wind powered by a pulsar, a rapidly spinning and highly magnetised neutron star.
The Crab Nebula is also highly unusual. Its atypical composition and very low explosion energy have previously led astronomers to think it was an electron-capture supernova — a rare type of explosion that arises from a star with a less-evolved core made of oxygen, neon, and magnesium, rather than a more typical iron core.
Past research efforts have calculated the total kinetic energy of the explosion based on the quantity and velocities of the present-day ejecta. Astronomers deduced that the nature of the explosion was one of relatively low energy (less than one-tenth that of a normal supernova), and the progenitor star’s mass was in the range of eight to 10 solar masses — teetering on the thin line between stars that experience a violent supernova death and those that do not.
However, inconsistencies exist between the electron-capture supernova theory and observations of the Crab, particularly the observed rapid motion of the pulsar. In recent years, astronomers have also improved their understanding of iron-core-collapse supernovae and now think that this type can also produce low-energy explosions, providing the stellar mass is adequately low.
To lower the level of uncertainty about the Crab’s progenitor star and the nature of the explosion, the science team used Webb’s spectroscopic capabilities to home in on two areas located within the Crab’s inner filaments.
Theories predict that because of the different chemical composition of the core in an electron-capture supernova, the nickel to iron (Ni/Fe) abundance ratio should be much higher than the ratio measured in our Sun (which contains these elements from previous generations of stars). Studies in the late 1980s and early 1990s measured the Ni/Fe ratio within the Crab using optical and near-infrared data and noted a high Ni/Fe abundance ratio that seemed to favour the electron-capture supernova scenario.
The Webb telescope, with its sensitive infrared capabilities, is now advancing Crab Nebula research. The team used MIRI’s spectroscopic abilities to measure the nickel and iron emission lines, resulting in a more reliable estimate of the Ni/Fe abundance ratio. They found that the ratio was still elevated compared to the Sun, but only modestly so and much lower in comparison to earlier estimates.
The revised values are consistent with electron-capture, but do not rule out an iron-core-collapse explosion from a similarly low-mass star. (Higher-energy explosions from higher-mass stars are expected to produce Ni/Fe ratios closer to solar abundances.) Further observational and theoretical work will be needed to distinguish between these two possibilities.
Besides pulling spectral data from two small regions of the Crab Nebula’s interior to measure the abundance ratio, the telescope also observed the remnant’s broader environment to understand details of the synchrotron emission and the dust distribution.
The images and data collected by MIRI enabled the team to isolate the dust emission within the Crab and map it in high resolution for the first time. By mapping the warm dust emission with Webb, and even combining it with the Herschel Space Observatory’s data on cooler dust grains, the team created a well-rounded picture of the dust distribution: the outermost filaments contain relatively warmer dust, while cooler grains are prevalent near the centre.
The observations were taken as part of the Webb General Observer programme 1714.
The NASA/ESA/CSA James Webb Space Telescope dissected the Crab Nebula’s structure, aiding astronomers as they continue to evaluate leading theories about the supernova remnant’s origins. With the data collected by Webb’s NIRCam (Near-Infrared Camera) and MIRI (Mid-Infrared Instrument), a team of scientists were able to closely inspect some of the Crab Nebula’s major components. For the first time ever, astronomers mapped the warm dust emission throughout this supernova remnant. Represented here as fluffy magenta material, the dust grains form a cage-like structure that is most apparent toward the lower left and upper right portions of the remnant. Filaments of dust are also threaded throughout the Crab’s interior and sometimes coincide with regions of doubly ionised sulphur (sulphur III), coloured in green. Yellow-white mottled filaments, which form large loop-like structures around the supernova remnant’s centre, represent areas where dust and doubly ionised sulphur overlap. The dust’s cage-like structure helps constrain some, but not all of the ghostly synchrotron emission represented in blue. The emission resembles wisps of smoke, most notable toward the Crab’s centre. The thin blue ribbons follow the magnetic field lines created by the Crab’s pulsar heart — a rapidly rotating neutron star. Credit: NASA, ESA, CSA, STScI, T. Temim (Princeton University)
Webb and Hubble telescopes affirm Universe’s expansion rate, puzzle persists
Webb measurements shed new light on a decade-long mystery.
The rate at which the Universe is expanding, known as the Hubble constant, is one of the fundamental parameters for understanding the evolution and ultimate fate of the cosmos. However, a persistent difference, called the Hubble Tension, is seen between the value of the constant measured with a wide range of independent distance indicators and its value predicted from the afterglow of the Big Bang. The NASA/ESA/CSA James Webb Space Telescope has confirmed that the Hubble Space Telescope’s keen eye was right all along, erasing any lingering doubt about Hubble’s measurements.
One of the scientific justifications for building the NASA/ESA Hubble Space Telescope was to use its observing power to provide an exact value for the expansion rate of the Universe. Prior to Hubble’s launch in 1990, observations from ground-based telescopes yielded huge uncertainties. Depending on the values deduced for the expansion rate, the Universe could be anywhere between 10 and 20 billion years old. Over the past 34 years Hubble has shrunk this measurement to an accuracy of less than one percent, splitting the difference with an age value of 13.8 billion years. This has been accomplished by refining the so-called ‘cosmic distance ladder’ by measuring important milepost markers known as Cepheid variable stars.
At the centre of these side-by-side images is a special class of star used as a milepost marker for measuring the Universe’s rate of expansion — a Cepheid variable star. The two images are very pixelated because each is a very zoomed-in view of a distant galaxy. Each of the pixels represents one or more stars. The image from the James Webb Space Telescope is significantly sharper at near-infrared wavelengths than Hubble (which is primarily a visible-ultraviolet light telescope). By reducing the clutter with Webb’s crisper vision, the Cepheid stands out more clearly, eliminating any potential confusion. Webb was used to look at a sample of Cepheids and confirmed the accuracy of the previous Hubble observations that are fundamental to precisely measuring the Universe’s expansion rate and age. Credit: NASA, ESA, CSA, STScI, A. Riess (JHU/STScI)
However, the Hubble value does not agree with other measurements that imply that the Universe was expanding faster after the Big Bang. These observations were made by the ESA Planck satellite’s mapping of the cosmic microwave background radiation — a blueprint for how the Universe would evolve structure after it cooled down from the Big Bang.
The simple solution to the dilemma would be to say that maybe the Hubble observations are wrong, as a rresult of some inaccuracy creeping into its measurements of the deep-space yardsticks. Then along came the James Webb Space Telescope, enabling astronomers to crosscheck Hubble’s results. Webb’s infrared views of Cepheids agreed with Hubble’s optical-light data. Webb confirmed that the Hubble telescope’s keen eye was right all along, erasing any lingering doubt about Hubble’s measurements.
The bottom line is that the so-called Hubble Tension between what happens in the nearby Universe compared to the early Universe’s expansion remains a nagging puzzle for cosmologists. There may be something woven into the fabric of space that we don’t yet understand.
Does resolving this discrepancy require new physics? Or is it a result of measurement errors between the two different methods used to determine the rate of expansion of space?
Hubble and Webb have now tag-teamed to produce definitive measurements, furthering the case that something else — not measurement errors — is influencing the expansion rate.
“With measurement errors negated, what remains is the real and exciting possibility that we have misunderstood the Universe,”
said Adam Riess, a physicist at Johns Hopkins University in Baltimore. Riess holds a Nobel Prize for co-discovering the fact that the Universe’s expansion is accelerating, owing to a mysterious phenomenon now called ‘dark energy’.
As a crosscheck, an initial Webb observation in 2023 confirmed that Hubble’s measurements of the expanding Universe were accurate. However, hoping to relieve the Hubble Tension, some scientists speculated that unseen errors in the measurement may grow and become visible as we look deeper into the Universe. In particular, stellar crowding could affect brightness measurements of more distant stars in a systematic way.
The SH0ES (Supernova H0 for the Equation of State of Dark Energy) team, led by Riess, obtained additional observations with Webb of objects that are critical cosmic milepost markers, known as Cepheid variable stars, which can now be correlated with the Hubble data.
“We’ve now spanned the whole range of what Hubble observed, and we can rule out a measurement error as the cause of the Hubble Tension with very high confidence,” Riess said.
The team’s first few Webb observations in 2023 were successful in showing Hubble was on the right track in firmly establishing the fidelity of the first rungs of the so-called cosmic distance ladder.
Astronomers use various methods to measure relative distances in the Universe, depending upon the object being observed. Collectively these techniques are known as the cosmic distance ladder — each rung or measurement technique relies upon the previous step for calibration.
But some astronomers suggested that, moving outward along the ‘second rung’, the cosmic distance ladder might get shaky if the Cepheid measurements become less accurate with distance. Such inaccuracies could occur because the light of a Cepheid could blend with that of an adjacent star — an effect that could become more pronounced with distance as stars crowd together on the sky and become harder to distinguish from one another.
The observational challenge is that past Hubble images of these more distant Cepheid variables look more huddled and overlapping with neighbouring stars at ever greater distances between us and their host galaxies, requiring careful accounting for this effect. Intervening dust further complicates the certainty of the measurements in visible light. Webb slices through the dust and naturally isolates the Cepheids from neighbouring stars because its vision is sharper than Hubble’s at infrared wavelengths.
“Combining Webb and Hubble gives us the best of both worlds. We find that the Hubble measurements remain reliable as we climb farther along the cosmic distance ladder,” said Riess.
This image of NGC 5468, a galaxy located about 130 million light-years from Earth, combines data from the Hubble and James Webb space telescopes. This is the most distant galaxy in which Hubble has identified Cepheid variable stars. These are important milepost markers for measuring the expansion rate of the Universe. The distance calculated from Cepheids has been cross-correlated with a Type Ia supernova in the galaxy. Type Ia supernovae are so bright they are used to measure cosmic distances far beyond the range of the Cepheids, extending measurements of the Universe’s expansion rate deeper into space. Credit: NASA, ESA, CSA, STScI, A. Riess (JHU/STScI)
The new Webb observations include five host galaxies of eight Type Ia supernovae containing a total of 1000 Cepheids, and reach out to the farthest galaxy where Cepheids have been well measured — NGC 5468, at a distance of 130 million light-years.
“This spans the full range where we made measurements with Hubble. So, we’ve gone to the end of the second rung of the cosmic distance ladder,”
said co-author Gagandeep Anand of the Space Telescope Science Institute in Baltimore, which operates the Webb and Hubble Telescopes for NASA.
Together, Hubble’s and Webb’s confirmation of the Hubble Tension sets up other observatories to possibly settle the mystery, including NASA’s upcoming Nancy Grace Roman Space Telescope and ESA’s recently launched Euclid mission.
At present it’s as though the distance ladder observed by Hubble and Webb has firmly set an anchor point on one shoreline of a river, and the afterglow of the Big Bang observed by Planck from the beginning of the Universe is set firmly on the other side. How the Universe’s expansion was changing in the billions of years between these two endpoints has yet to be directly observed.
“We need to find out if we are missing something on how to connect the beginning of the Universe and the present day,” said Riess.
These findings were published in the 6 February 2024 issue of The Astrophysical Journal Letters.
GJ 367 b, A PLANET WITH AN IRON HEART IN AN EXTRASOLAR SYSTEM
THE DISCOVERY MADE BY A TEAM AT THE UNIVERSITY OF TURIN ADDS TO THE PUZZLE HOW PLANETS FORM
Researchers at the University of Turin and at the Thüringer Landessternwarte have confirmed that the extrasolar planet GJ 367 b has an ultra-high density – almost twice the density of Earth. The research team also found two more planets that orbit the same star.
Over the past decades, astronomers have found several thousand extrasolar planets. Extrasolar planets orbit stars outside our solar system. The next frontier in this research field is to learn more about their composition and internal structure, in order to develop a better understanding of how planets form.
Elisa Goffo is part of the international KESPRINT collaboration, which confirmed that the ultra-short period exoplanet GJ 367 b, whose orbital period is only 7.7 hours, is also ultra-dense. The density of a planet can be determined from its mass and radius. GJ 367 b is ultra-dense because the researchers found its density to be 10.2 grams per cubic centimeter. That is almost twice the density of Earth, suggesting that this extrasolar planet consists almost entirely of iron.
An unusual composition
Such a composition of a planet is very rare, raising questions about its formation.
“You could compare GJ 367 b to an Earth-like planet with its rocky mantle stripped away. This could have important implications for the formation of GJ 367 b. We believe that the planet might have formed like the Earth, with a dense core made mainly of iron, surrounded by a silicate-rich mantle. A catastrophic event could have stripped away its rocky mantle, leaving the dense core of the planet naked. Alternatively, GJ 367 b was born in an iron-rich region of the protoplanetary disc”,
explains Elisa Goffo. While observing GJ 367 b, the team discovered two additional low-mass planets that orbit around the star GJ 367 in 11.5 days and 34 days, respectively. These three planets and their star comprise an extrasolar system.
GJ 367 b was first found with the Transiting Exoplanet Survey Satellite (TESS), a space telescope operated by NASA. TESS uses the transit method to measure the radii of exoplanets – among other properties. In order to precisely measure the mass of GJ 367 b and confirm that the planet has a very high density, the KESPRINT researchers at the University of Turin and at the Thüringer Landessternwarte acquired nearly 300 radial velocity measurements using the HARPS spectrograph, a high-precision instrument installed at the 3.6 meter telescope operated by the European Southern Observatory (ESO) at La Silla Observatory, Chile.
“Thanks to our intensive observations with the HARPS spectrograph we discovered the presence of two additional low-mass planets with orbital periods of 11.5 and 34 days, which reduce the number of possible scenarios that might have led to the formation of such a dense planet”, says Davide Gandolfi, Professor at the University of Turin. “While GJ 367 b might have formed in an iron-rich environment, we do not exclude a formation scenario involving violent events like giant planet collisions.”
Artie Hatzes, director at the Thüringer Landessternwarte, underscores the relevance of this discovery: “GJ 367 b is an extreme case of an exoplanet. Before we can develop viable theories of its formation, we must precisely measure the planetary mass and radius. We expect an extrasolar system to consist of several planets, so it was important to search for and to find other planets orbiting in the system – to study its architecture.”
MORE INFORMATION
KESPRINT: Consisting of more than 40 members in nine countries (Czech Republic, Denmark, Germany, Italy, Japan, Spain, Sweden, UK, USA), the KESPRINT research consortium is devoted to the confirmation and characterization of transiting exoplanets found by space missions (e.g. Kepler, K2, TESS), with a special emphasis on the characterization of the smallest planets. Its members are from the Dipartimento di Fisica, Università di Torino, Italy, Thüringer Landessternwarte Tautenburg, Germany, Institute of Planetary Research, German Aerospace Center (DLR), Germany, Technische Universität Berlin, Germany, Rheinisches Institut für Umweltforschung an der Universität zu Köln, Germany, Astronomical Institute of the Czech Academy of Sciences, Czech Republic, Chalmers University of Technology, Sweden, Instituto de Astrofísica de Canarias, Spain, Mullard Space Science Laboratory, University College London, UK, University of Oxford, UK, Stellar Astrophysics Centre, Department of Physics and Astronomy, Aarhus University, Denmark, Astronomy Department and Van Vleck Observatory, Wesleyan University, USA, McDonald Observatory, The University of Texas at Austin, USA, The University of Tokyo, Japan, Astrobiology Center, National Institute of Natural Sciences, Japan.
GJ 367 b and the exoplanet naming convention: Planets are usually named after their host stars, adding a lowercase letter. A planet around the star GJ 367 is called GJ 367 b, c, or d. However, the planet GJ 367 b and its star GJ 367 were named in 2022 during the “NameExoWorlds” project coordinated by the International Astronomical Union. The planet GJ 367 b is called Tahay and its star is called Añañuca, after Chilean wildflowers.
The 7.7 hours period during which GJ 367 b orbits its star stands out even among other ultra-short period planets because it is such a short orbit. One year on this planet is only 7.7 hours long. Its mass is 60 % that of Earth’s mass. Its radius is 70 % that of Earth’s radius. Therefore, it is smaller and less massive than the Earth.
Due to its proximity to the host star, the dayside surface of the planet is expected to have a temperature of almost 1.100 degrees Celsius. The star GJ 367 (Añañuca) is located roughly 31 light years from Earth, i.e., it takes about 31 years for the light to travel this distance.
How the transit method works: NASA’s TESS telescope uses the transit method to search for planets around stars other than the Sun. A transit occurs when a planet moves between its host star and us. Whenever it passes in front of its star, it blocks a small portion of the star’s light. The transit method measures this change in brightness, which yields the orbital period and inclination, the planetary radius, and other parameters.
How the radial velocity method works: The KESPRINT team observes exoplanets with the radial velocity method, which detects the existence of a planet around a star via the Doppler effect. We usually say that planets orbit stars, but that’s not entirely true: planets and stars orbit around their common center of mass! Stars emit light at different colors that become bluer or redder depending on whether the stars are moving toward or away from us while orbiting around the center of mass. When combined with the transit method, radial velocity measurements provide the mass of the planet.
The Physics Department at the University of Turin. Over the past decade, the Exoplanet group at the Physics Department of the University of Turin has focused on the detection and characterization of planets orbiting stars other than the Sun, especially those transiting their host stars, combining space-based observations with high-precision spectroscopy. The group at the University of Turin has led and coordinated the observations of GJ 367 carried out with the HARPS spectrograph.