New insights into the evolution and paleoecology of mosasaurs (Sarabosaurus dahli): most comprehensive study to date
Iconic extinct marine lizards continue to surprise us
Mosasaurs are extinct marine lizards, spectacular examples of which were first discovered in 1766 near Maastricht in the Netherlands, fueling the rise of the field of vertebrate palaeontology (the study of fossil remains of animals with backbones). Palaeontologist Michael Polcyn presented the most comprehensive study to date on the early evolution and ecology of these extinct marine reptiles. On 16 December 2024, Polcyn will receive his PhD from Utrecht University for his research into the evolution of the mosasaurs.
“Mosasaurs are a textbook example of macroevolution, the emergence of new and distinct groups of animals, above the level of species. Although they have been studied for centuries, new discoveries, novel research approaches, and the application of technology, are still teaching us about their relationships and behaviors, some of which continues to surprise us. For example, through the use of detailed comparative anatomy aided by micro-CT scanning technology, we have gained a much better understanding of what group of lizards mosasaurs likely evolved from.”
Additionally, use of these advanced imaging technologies has allowed him to study the internal structures of the braincases of mosasaurs, and sort out the early evolutionary relationships of some previously problematic fossil taxa.
“This study not only addressed the early evolution of the group, but also explored small- and large-scale aspects of their feeding biology,” Polcyn continued. “One spectacular example was a specimen I discovered in Angola, that had the remains of three other mosasaurs in its stomach, one of which was the same taxon as the predator, and documented the first occurrence of cannibalism in mosasaurs.”
To the sea
Mosasaurs belong to a group of lizards that took to the sea about 100 million years ago (just like the ancestors of the whales later did). Throughout their 34-million-year history, they evolved into well-adapted marine animals that occupied a wide variety of niches and habitats. Together with a large number of other species, they became extinct 66 million years ago, in the aftermath of the meteorite impact that also wiped out the dinosaurs.
“A relatively large number of fossils are known from the second half of the evolutionary history of mosasaurs, allowing a good understanding of the relationships among those species, which have been classified into four major groups,” says Polcyn. “Much less is known about their early evolutionary history, and how those major groups are related to one another, their origins, and the origin of mosasaurs as a whole.”
To address these gaps, Polcyn has focused on bringing new discoveries to light and restudying historical specimens with advanced imaging technologies, providing significant new anatomical information that is used to infer phylogenetic relationships. Polcyn’s work helps resolve a long-running scientific debate, concluding mosasaurs are not very closely related to snakes, but supporting the idea that their closest relatives are near the monitor lizards.
You are what you eat
Not much was previously known about the feeding habits of mosasaurs either, but a small, yet no less remarkable gap in that knowledge was filled with the discovery, by Polcyn in Angola, of a fossilized mosasaur with three other mosasaurs in its stomach, one being the same species as the predator.
“Whether that mosasaur was a scavenger or actively hunted its prey cannot be said with certainty; however, we do have the first documented example of cannibalism in mosasaurs. Additionally, we gained insights into how mosasaurs processed their prey, and relative body size of prey and predator.”
Also included in his dissertation is a large-scale study of the feeding behaviour of mosasaurs, looking at how mosasaurs divided their foraging areas through the evolutionary history of the group. Polcyn integrated previously published data, along with a new, very large sample that covered a period from 92 to 66 million years ago and included finds from all over the world. The result of that study illuminate patterns of foraging area segregation, and feeding diversity in mosasaurs.
About
Polcyn’s entry into palaeontology followed a non-traditional academic path. After serving in the U.S. submarine service and a career in technology and engineering, he devoted himself to research on extinct vertebrates, with a focus on marine reptiles. He is currently a Senior Research Fellow at ISEM at Southern Methodist University in Dallas, Texas.
New insights into the evolution and paleoecology of mosasaurs (Sarabosaurus dahli): the most comprehensive study to date. Sarabosaurus dahli life reconstruction. Credits: Andrey Atuchin
Astronomers reveal first image of the black hole at the heart of our galaxy
Today, at simultaneous press conferences around the world, including at the European Southern Observatory (ESO) headquarters in Germany, astronomers have unveiled the first image of the supermassive black hole at the centre of our own Milky Way galaxy. This result provides overwhelming evidence that the object is indeed a black hole and yields valuable clues about the workings of such giants, which are thought to reside at the centre of most galaxies. The image was produced by a global research team called the Event Horizon Telescope (EHT) Collaboration, using observations from a worldwide network of radio telescopes.
The black hole at the heart of our galaxy. This artist’s impression depicts a rapidly spinning supermassive black hole surrounded by an accretion disc. This thin disc of rotating material consists of the leftovers of a Sun-like star which was ripped apart by the tidal forces of the black hole. The black hole is labelled, showing the anatomy of this fascinating object. Credit:ESOThe black hole at the heart of our galaxy. This chart shows the location of the field of view within which Sagittarius A* resides — the black hole is marked with a red circle within the constellation of Sagittarius (The Archer). This map shows most of the stars visible to the unaided eye under good conditions. Credit:ESO, IAU and Sky & Telescope
The image is a long-anticipated look at the massive object that sits at the very centre of our galaxy. Scientists had previously seen stars orbiting around something invisible, compact, and very massive at the centre of the Milky Way. This strongly suggested that this object — known as Sagittarius A* (Sgr A*, pronounced “sadge-ay-star”) — is a black hole, and today’s image provides the first direct visual evidence of it.
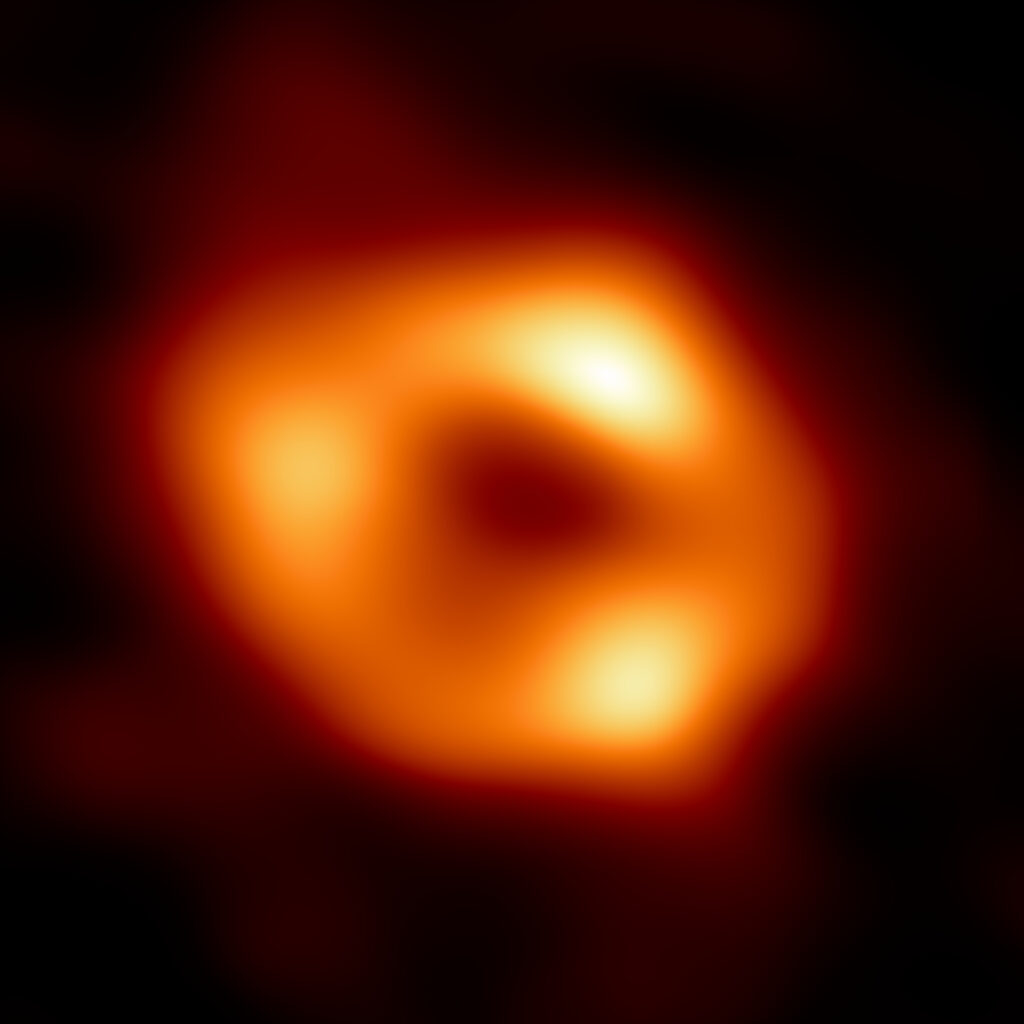
The black hole at the heart of our galaxy. This is the first image of Sgr A*, the supermassive black hole at the centre of our galaxy. It’s the first direct visual evidence of the presence of this black hole. It was captured by the Event Horizon Telescope (EHT), an array which linked together eight existing radio observatories across the planet to form a single “Earth-sized” virtual telescope. The telescope is named after the event horizon, the boundary of the black hole beyond which no light can escape. Although we cannot see the event horizon itself, because it cannot emit light, glowing gas orbiting around the black hole reveals a telltale signature: a dark central region (called a shadow) surrounded by a bright ring-like structure. The new view captures light bent by the powerful gravity of the black hole, which is four million times more massive than our Sun. The image of the Sgr A* black hole is an average of the different images the EHT Collaboration has extracted from its 2017 observations. In addition to other facilities, the EHT network of radio observatories that made this image possible includes the Atacama Large Millimeter/submillimeter Array (ALMA) and the Atacama Pathfinder EXperiment (APEX) in the Atacama Desert in Chile, co-owned and co-operated by ESO is a partner on behalf of its member states in Europe. Credit: EHT Collaboration
Although we cannot see the black hole itself, because it is completely dark, glowing gas around it reveals a telltale signature: a dark central region (called a shadow) surrounded by a bright ring-like structure. The new view captures light bent by the powerful gravity of the black hole, which is four million times more massive than our Sun.
“We were stunned by how well the size of the ring agreed with predictions from Einstein’s Theory of General Relativity,” said EHT Project Scientist Geoffrey Bower from the Institute of Astronomy and Astrophysics, Academia Sinica, Taipei. “These unprecedented observations have greatly improved our understanding of what happens at the very centre of our galaxy, and offer new insights on how these giant black holes interact with their surroundings.” The EHT team’s results are being published today in a special issue of The Astrophysical Journal Letters.
Because the black hole is about 27 000 light-years away from Earth, it appears to us to have about the same size in the sky as a doughnut on the Moon. To image it, the team created the powerful EHT, which linked together eight existing radio observatories across the planet to form a single “Earth-sized” virtual telescope [1]. The EHT observed Sgr A* on multiple nights in 2017, collecting data for many hours in a row, similar to using a long exposure time on a camera.
The black hole at the heart of our galaxy. The Event Horizon Telescope (EHT) Collaboration has created a single image (top frame) of the supermassive black hole at the centre of our galaxy, called Sagittarius A*, or Sgr A* for short, by combining images extracted from the EHT observations. The main image was produced by averaging together thousands of images created using different computational methods — all of which accurately fit the EHT data. This averaged image retains features more commonly seen in the varied images, and suppresses features that appear infrequently. The images can also be clustered into four groups based on similar features. An averaged, representative image for each of the four clusters is shown in the bottom row. Three of the clusters show a ring structure but, with differently distributed brightness around the ring. The fourth cluster contains images that also fit the data but do not appear ring-like. The bar graphs show the relative number of images belonging to each cluster. Thousands of images fell into each of the first three clusters, while the fourth and smallest cluster contains only hundreds of images. The heights of the bars indicate the relative “weights,” or contributions, of each cluster to the averaged image at top. In addition to other facilities, the EHT network of radio observatories that made this image possible includes the Atacama Large Millimeter/submillimeter Array (ALMA) and the Atacama Pathfinder EXperiment (APEX) in the Atacama Desert in Chile, co-owned and co-operated by ESO is a partner on behalf of its member states in Europe. Credit: EHT Collaboration
In addition to other facilities, the EHT network of radio observatories includes the Atacama Large Millimeter/submillimeter Array (ALMA) and the Atacama Pathfinder EXperiment (APEX) in the Atacama Desert in Chile, co-owned and co-operated by ESO on behalf of its member states in Europe. Europe also contributes to the EHT observations with other radio observatories — the IRAM 30-meter telescope in Spain and, since 2018, the NOrthern Extended Millimeter Array (NOEMA) in France — as well as a supercomputer to combine EHT data hosted by the Max Planck Institute for Radio Astronomy in Germany. Moreover, Europe contributed with funding to the EHT consortium project through grants by the European Research Council and by the Max Planck Society in Germany.
This image shows the Atacama Large Millimeter/submillimeter Array (ALMA) looking up at the Milky Way as well as the location of Sagittarius A*, the supermassive black hole at our galactic centre. Highlighted in the box is the image of Sagittarius A* taken by the Event Horizon Telescope (EHT) Collaboration. Located in the Atacama Desert in Chile, ALMA is the most sensitive of all the observatories in the EHT array, and ESO is a co-owner of ALMA on behalf of its European Member States. Credit: ESO/José Francisco Salgado (josefrancisco.org), EHT Collaboration
“It is very exciting for ESO to have been playing such an important role in unravelling the mysteries of black holes, and of Sgr A* in particular, over so many years,” commented ESO Director General Xavier Barcons. “ESO not only contributed to the EHT observations through the ALMA and APEX facilities but also enabled, with its other observatories in Chile, some of the previous breakthrough observations of the Galactic centre.” [2]
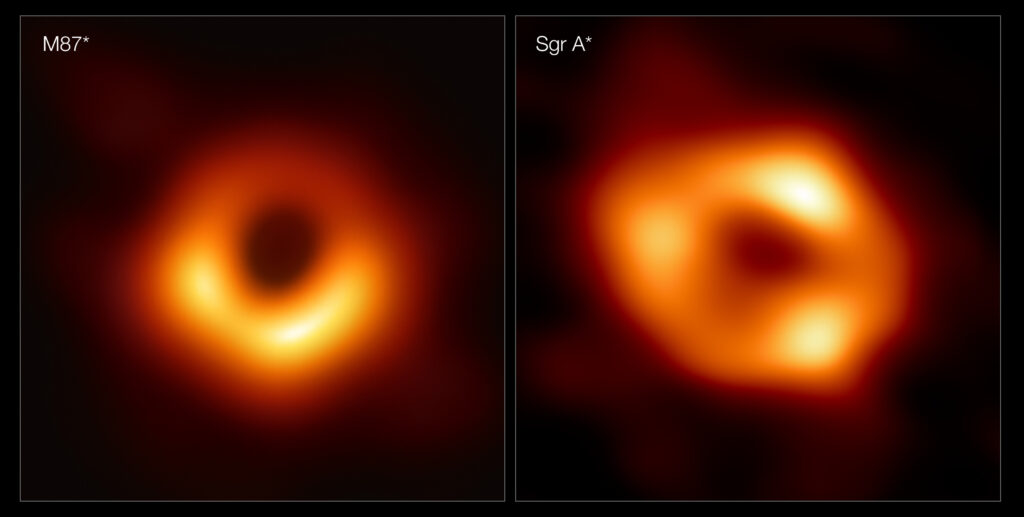
The EHT achievement follows the collaboration’s 2019 release of the first image of a black hole, called M87*, at the centre of the more distant Messier 87 galaxy.
These panels show the first two images ever taken of black holes. On the left is M87*, the supermassive black hole at the centre of the galaxy Messier 87 (M87), 55 million light-years away. On the right is Sagittarius A* (Sgr A*), the black hole at the centre of our Milky Way. The two images show the black holes as they would appear in the sky, with their bright rings appearing to be roughly the same size, despite M87* being around a thousand times larger than Sgr A*. The images were captured by the Event Horizon Telescope (EHT), a global network of radio telescopes including the Atacama Large Millimeter/submillimeter Array (ALMA) and Atacama Pathfinder EXperiment (APEX), in which ESO is co-owner. Credit: EHT Collaboration
The two black holes look remarkably similar, even though our galaxy’s black hole is more than a thousand times smaller and less massive than M87* [3].
“We have two completely different types of galaxies and two very different black hole masses, but close to the edge of these black holes they look amazingly similar,” says Sera Markoff, Co-Chair of the EHT Science Council and a professor of theoretical astrophysics at the University of Amsterdam, the Netherlands.
“This tells us that General Relativity governs these objects up close, and any differences we see further away must be due to differences in the material that surrounds the black holes.”
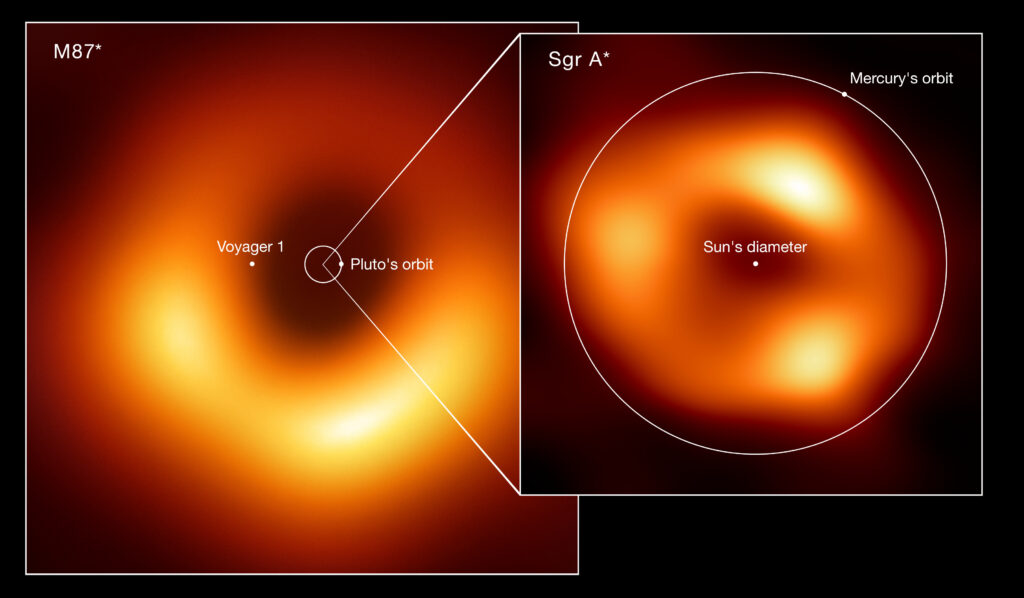
Size comparison of the two black holes imaged by the Event Horizon Telescope (EHT) Collaboration: M87*, at the heart of the galaxy Messier 87, and Sagittarius A* (Sgr A*), at the centre of the Milky Way. The image shows the scale of Sgr A* in comparison with both M87* and other elements of the Solar System such as the orbits of Pluto and Mercury. Also displayed is the Sun’s diameter and the current location of the Voyager 1 space probe, the furthest spacecraft from Earth. M87*, which lies 55 million light-years away, is one of the largest black holes known. While Sgr A*, 27 000 light-years away, has a mass roughly four million times the Sun’s mass, M87* is more than 1000 times more massive. Because of their relative distances from Earth, both black holes appear the same size in the sky. Credit: EHT collaboration (acknowledgment: Lia Medeiros, xkcd)
This achievement was considerably more difficult than for M87*, even though Sgr A* is much closer to us. EHT scientist Chi-kwan (‘CK’) Chan, from Steward Observatory and Department of Astronomy and the Data Science Institute of the University of Arizona, USA, explains:
“The gas in the vicinity of the black holes moves at the same speed — nearly as fast as light — around both Sgr A* and M87*. But where gas takes days to weeks to orbit the larger M87*, in the much smaller Sgr A* it completes an orbit in mere minutes. This means the brightness and pattern of the gas around Sgr A* were changing rapidly as the EHT Collaboration was observing it — a bit like trying to take a clear picture of a puppy quickly chasing its tail.”
The researchers had to develop sophisticated new tools that accounted for the gas movement around Sgr A*. While M87* was an easier, steadier target, with nearly all images looking the same, that was not the case for Sgr A*. The image of the Sgr A* black hole is an average of the different images the team extracted, finally revealing the giant lurking at the centre of our galaxy for the first time.
The effort was made possible through the ingenuity of more than 300 researchers from 80 institutes around the world that together make up the EHT Collaboration. In addition to developing complex tools to overcome the challenges of imaging Sgr A*, the team worked rigorously for five years, using supercomputers to combine and analyse their data, all while compiling an unprecedented library of simulated black holes to compare with the observations.
Scientists are particularly excited to finally have images of two black holes of very different sizes, which offers the opportunity to understand how they compare and contrast. They have also begun to use the new data to test theories and models of how gas behaves around supermassive black holes. This process is not yet fully understood but is thought to play a key role in shaping the formation and evolution of galaxies.
“Now we can study the differences between these two supermassive black holes to gain valuable new clues about how this important process works,” said EHT scientist Keiichi Asada from the Institute of Astronomy and Astrophysics, Academia Sinica, Taipei. “We have images for two black holes — one at the large end and one at the small end of supermassive black holes in the Universe — so we can go a lot further in testing how gravity behaves in these extreme environments than ever before.”
Progress on the EHT continues: a major observation campaign in March 2022 included more telescopes than ever before. The ongoing expansion of the EHT network and significant technological upgrades will allow scientists to share even more impressive images as well as movies of black holes in the near future.
This visible light wide-field view shows the rich star clouds in the constellation of Sagittarius (the Archer) in the direction of the centre of our Milky Way galaxy. The entire image is filled with vast numbers of stars — but far more remain hidden behind clouds of dust and are only revealed in infrared images. This view was created from photographs in red and blue light and form part of the Digitized Sky Survey 2. The field of view is approximately 3.5 degrees x 3.6 degrees. Credit:ESO and Digitized Sky Survey 2. Acknowledgment: Davide De Martin and S. Guisard (www.eso.org/~sguisard)
The black hole at the heart of our galaxy
Notes
[1] The individual telescopes involved in the EHT in April 2017, when the observations were conducted, were: the Atacama Large Millimeter/submillimeter Array (ALMA), the Atacama Pathfinder EXperiment (APEX), the IRAM 30-meter Telescope, the James Clerk Maxwell Telescope (JCMT), the Large Millimeter Telescope Alfonso Serrano (LMT), the Submillimeter Array (SMA), the UArizona Submillimeter Telescope (SMT), the South Pole Telescope (SPT). Since then, the EHT has added the Greenland Telescope (GLT), the NOrthern Extended Millimeter Array (NOEMA) and the UArizona 12-meter Telescope on Kitt Peak to its network.
ALMA is a partnership of the European Southern Observatory (ESO; Europe, representing its member states), the U.S. National Science Foundation (NSF), and the National Institutes of Natural Sciences (NINS) of Japan, together with the National Research Council (Canada), the Ministry of Science and Technology (MOST; Taiwan), Academia Sinica Institute of Astronomy and Astrophysics (ASIAA; Taiwan), and Korea Astronomy and Space Science Institute (KASI; Republic of Korea), in cooperation with the Republic of Chile. The Joint ALMA Observatory is operated by ESO, the Associated Universities, Inc./National Radio Astronomy Observatory (AUI/NRAO) and the National Astronomical Observatory of Japan (NAOJ). APEX, a collaboration between the Max Planck Institute for Radio Astronomy (Germany), the Onsala Space Observatory (Sweden) and ESO, is operated by ESO. The 30-meter Telescope is operated by IRAM (the IRAM Partner Organizations are MPG [Germany], CNRS [France] and IGN [Spain]). The JCMT is operated by the East Asian Observatory on behalf of The National Astronomical Observatory of Japan; ASIAA; KASI; the National Astronomical Research Institute of Thailand; the Center for Astronomical Mega-Science and organisations in the United Kingdom and Canada. The LMT is operated by INAOE and UMass, the SMA is operated by Center for Astrophysics | Harvard & Smithsonian and ASIAA and the UArizona SMT is operated by the University of Arizona. The SPT is operated by the University of Chicago with specialised EHT instrumentation provided by the University of Arizona.
The Greenland Telescope (GLT) is operated by ASIAA and the Smithsonian Astrophysical Observatory (SAO). The GLT is part of the ALMA-Taiwan project, and is supported in part by the Academia Sinica (AS) and MOST. NOEMA is operated by IRAM and the UArizona 12-meter telescope at Kitt Peak is operated by the University of Arizona.
A montage of the radio observatories that form the Event Horizon Telescope (EHT) network, used to image the Milky Way’s central black hole, Sagittarius A*. These include the Atacama Large Millimeter/submillimeter Array (ALMA), the Atacama Pathfinder EXperiment (APEX), IRAM 30-meter telescope, James Clark Maxwell Telescope (JCMT), Large Millimeter Telescope (LMT), Submillimeter Array (SMA), Submillimetere Telescope (SMT) and South Pole Telescope (SPT). The slightly transparent telescopes in the background, represent the three telescopes added to the EHT Collaboration after 2018: the Greenland Telescope, the NOrthern Extended Millimeter Array (NOEMA) in France, and the UArizona ARO 12-meter Telescope at Kitt Peak. These telescopes were added to the array after the 2017 observations of Sagittarius A*. Credit: ESO/M. Kornmesser. Images of individual telescopes: ALMA: ESO APEX: ESO LMT: INAOE Archives GLT: N. Patel JCMT: EAO-W. Montgomerie SMT: D. Harvey 30m: N. Billot SPT: Wikipedia SMA: S. R. Schimpf NOEMA: IRAM Kitt Peak: Wikipedia Milky Way: N. Risinger (skysurvey.org)A montage of the radio observatories that form the Event Horizon Telescope (EHT) network used to image the Milky Way’s central black hole, Sagittarius A*. These include the Atacama Large Millimeter/submillimeter Array (ALMA), the Atacama Pathfinder EXperiment (APEX), IRAM 30-meter telescope, James Clark Maxwell Telescope (JCMT), Large Millimeter Telescope (LMT), Submillimeter Array (SMA), Submillimeter Telescope (SMT) and South Pole Telescope (SPT). The slightly transparent telescopes in the background represent the three telescopes added to the EHT network after 2018: the Greenland Telescope, the NOrthern Extended Millimeter Array (NOEMA) in France, and the UArizona ARO 12-meter Telescope at Kitt Peak. These telescopes were added to the array after the 2017 observations of Sagittarius A*. Credit: ESO/M. Kornmesser. Images of individual telescopes: ALMA: ESO APEX: ESO LMT: INAOE Archives GLT: N. Patel JCMT: EAO-W. Montgomerie SMT: D. Harvey 30m: N. Billot SPT: Wikipedia SMA: S. R. Schimpf NOEMA: IRAM Kitt Peak: Wikipedia Milky Way: N. Risinger (skysurvey.org)
[2] A strong basis for the interpretation of this new image was provided by previous research carried out on Sgr A*. Astronomers have known the bright, dense radio source at the centre of the Milky Way in the direction of the constellation Sagittarius since the 1970s. By measuring the orbits of several stars very close to our galactic centre over a period of 30 years, teams led by Reinhard Genzel (Director at the Max –Planck Institute for Extraterrestrial Physics in Garching near Munich, Germany) and Andrea M. Ghez (Professor in the Department of Physics and Astronomy at the University of California, Los Angeles, USA) were able to conclude that the most likely explanation for an object of this mass and density is a supermassive black hole. ESO’s facilities (including the Very Large Telescope and the Very Large Telescope Interferometer) and the Keck Observatory were used to carry out this research, which shared the 2020 Nobel Prize in Physics.
[3] Black holes are the only objects we know of where mass scales with size. A black hole a thousand times smaller than another is also a thousand times less massive.
The black hole at the heart of our galaxy: more information
This research was presented in six papers published today in The Astrophysical Journal Letters.
A global map showing the radio observatories that form the Event Horizon Telescope (EHT) network used to image the Milky Way’s central black hole, Sagittarius A*. The telescopes highlighted in yellow were part of the EHT network during the observations of Sagittarius A* in 2017. These include the Atacama Large Millimeter/submillimeter Array (ALMA), the Atacama Pathfinder EXperiment (APEX), IRAM 30-meter telescope, James Clark Maxwell Telescope (JCMT), Large Millimeter Telescope (LMT), Submillimeter Array (SMA), Submillimetere Telescope (SMT) and South Pole Telescope (SPT). Highlighted in blue are the three telescopes added to the EHT Collaboration after 2018: the Greenland Telescope, the NOrthern Extended Millimeter Array (NOEMA) in France, and the UArizona ARO 12-meter Telescope at Kitt Peak. Credit:ESO/M. Kornmesser
The EHT collaboration involves more than 300 researchers from Africa, Asia, Europe, North and South America. The international collaboration aims to capture the most detailed black hole images ever obtained by creating a virtual Earth-sized telescope. Supported by considerable international efforts, the EHT links existing telescopes using novel techniques — creating a fundamentally new instrument with the highest angular resolving power that has yet been achieved.
This image shows the locations of some of the telescopes making up the EHT, as well as a representation of the long baselines between the telescopes. Credit:ESO/L. Calçada
The EHT consortium consists of 13 stakeholder institutes; the Academia Sinica Institute of Astronomy and Astrophysics, the University of Arizona, the Center for Astrophysics | Harvard & Smithsonian, the University of Chicago, the East Asian Observatory, Goethe-Universitaet Frankfurt, Institut de Radioastronomie Millimétrique, Large Millimeter Telescope, Max Planck Institute for Radio Astronomy, MIT Haystack Observatory, National Astronomical Observatory of Japan, Perimeter Institute for Theoretical Physics, and Radboud University.
This view shows several of the ALMA antennas and the central regions of the Milky Way above. In this wide field view, the zodiacal light is seen upper right and at lower left Mars is seen. Saturn is a bit higher in the sky towards the centre of the image. The image was taken during the ESO Ultra HD (UHD) Expedition. Credit:ESO/B. Tafreshi (twanight.org)
The Atacama Large Millimeter/submillimeter Array (ALMA), an international astronomy facility, is a partnership of ESO, the U.S. National Science Foundation (NSF) and the National Institutes of Natural Sciences (NINS) of Japan in cooperation with the Republic of Chile. ALMA is funded by ESO on behalf of its Member States, by NSF in cooperation with the National Research Council of Canada (NRC) and the Ministry of Science and Technology (MOST) and by NINS in cooperation with the Academia Sinica (AS) in Taiwan and the Korea Astronomy and Space Science Institute (KASI). ALMA construction and operations are led by ESO on behalf of its Member States; by the National Radio Astronomy Observatory (NRAO), managed by Associated Universities, Inc. (AUI), on behalf of North America; and by the National Astronomical Observatory of Japan (NAOJ) on behalf of East Asia. The Joint ALMA Observatory (JAO) provides the unified leadership and management of the construction, commissioning and operation of ALMA.
The slumbering Atacama Pathfinder Experiment (APEX) telescope sits beneath reddened skies amongst the snow covered Chajnantor landscape. Snow not only blankets the ground, but also the many peaks that encircle the Chilean plateau which also hosts the Atacama Large Millimeter/submillimeter Array (ALMA). Credit:Carlos A. Durán/ESO
APEX, Atacama Pathfinder EXperiment, is a 12-metre diameter telescope, operating at millimetre and submillimetre wavelengths — between infrared light and radio waves. ESO operates APEX at one of the highest observatory sites on Earth, at an elevation of 5100 metres, high on the Chajnantor plateau in Chile’s Atacama region. The telescope is a collaboration between the Max Planck Institute for Radio Astronomy (MPIfR), the Onsala Space Observatory (OSO), and ESO.
This image shows the dish of the Atacama Pathfinder Experiment (APEX) telescope seen perfectly from the side, including the starry sky. Credit:C. Duran/ESOESO Photo Ambassador Stéphane Guisard captured this astounding panorama from the site of ALMA, the Atacama Large Millimeter/submillimeter Array, in the Chilean Andes. The 5000-metre-high and extremely dry Chajnantor plateau offers the perfect place for this state-of-the-art telescope, which studies the Universe in millimetre- and submillimetre-wavelength light. Numerous giant antennas dominate the centre of the image. When ALMA is complete, it will have a total of 54 of these 12-metre-diameter dishes. Above the array, the arc of the Milky Way serves as a resplendent backdrop. When the panorama was taken, the Moon was lying close to the centre of the Milky Way in the sky, its light bathing the antennas in an eerie night-time glow. The Large and Small Magellanic Clouds, the biggest of the Milky Way’s dwarf satellite galaxies, appear as two luminous smudges in the sky on the left. A particularly bright meteor streak gleams near the Small Magellanic Cloud. On the right, some of ALMA’s smaller 7-metre antennas — twelve of which will be used to form the Atacama Compact Array — can be seen. Still further on the right shine the lights of the Array Operations Site Technical Building. And finally, looming behind this building is the dark, mountainous peak of Cerro Chajnantor. ALMA, an international astronomy facility, is a partnership of Europe, North America and East Asia in cooperation with the Republic of Chile. ALMA construction and operations are led on behalf of Europe by ESO, on behalf of North America by the National Radio Astronomy Observatory (NRAO), and on behalf of East Asia by the National Astronomical Observatory of Japan (NAOJ). The Joint ALMA Observatory (JAO) provides the unified leadership and management of the construction, commissioning and operation of ALMA. Links ESO Photo Ambassadors More about ALMA at ESO The Joint ALMA Observatory. Links ESO Photo Ambassadors More about ALMA at ESO The Joint ALMA Observatory Credit:ESO/S. Guisard (www.eso.org/~sguisard)
The European Southern Observatory (ESO) enables scientists worldwide to discover the secrets of the Universe for the benefit of all. We design, build and operate world-class observatories on the ground — which astronomers use to tackle exciting questions and spread the fascination of astronomy — and promote international collaboration in astronomy. Established as an intergovernmental organisation in 1962, today ESO is supported by 16 Member States (Austria, Belgium, the Czech Republic, Denmark, France, Finland, Germany, Ireland, Italy, the Netherlands, Poland, Portugal, Spain, Sweden, Switzerland and the United Kingdom), along with the host state of Chile and with Australia as a Strategic Partner. ESO’s headquarters and its visitor centre and planetarium, the ESO Supernova, are located close to Munich in Germany, while the Chilean Atacama Desert, a marvellous place with unique conditions to observe the sky, hosts our telescopes. ESO operates three observing sites: La Silla, Paranal and Chajnantor. At Paranal, ESO operates the Very Large Telescope and its Very Large Telescope Interferometer, as well as two survey telescopes, VISTA working in the infrared and the visible-light VLT Survey Telescope. Also at Paranal ESO will host and operate the Cherenkov Telescope Array South, the world’s largest and most sensitive gamma-ray observatory. Together with international partners, ESO operates APEX and ALMA on Chajnantor, two facilities that observe the skies in the millimetre and submillimetre range. At Cerro Armazones, near Paranal, we are building “the world’s biggest eye on the sky” — ESO’s Extremely Large Telescope. From our offices in Santiago, Chile we support our operations in the country and engage with Chilean partners and society.
The black hole at the heart of our galaxy. This is the first image of Sgr A*, the supermassive black hole at the centre of our galaxy, with an added black background to fit wider screens. It’s the first direct visual evidence of the presence of this black hole. It was captured by the Event Horizon Telescope (EHT), an array which linked together eight existing radio observatories across the planet to form a single “Earth-sized” virtual telescope. The telescope is named after the event horizon, the boundary of the black hole beyond which no light can escape. Although we cannot see the event horizon itself, because it cannot emit light, glowing gas orbiting around the black hole reveals a telltale signature: a dark central region (called a shadow) surrounded by a bright ring-like structure. The new view captures light bent by the powerful gravity of the black hole, which is four million times more massive than our Sun. The image of the Sgr A* black hole is an average of the different images the EHT Collaboration has extracted from its 2017 observations. In addition to other facilities, the EHT network of radio observatories that made this image possible includes the Atacama Large Millimeter/submillimeter Array (ALMA) and the Atacama Pathfinder EXperiment (APEX) in the Atacama Desert in Chile, co-owned and co-operated by ESO is a partner on behalf of its member states in Europe. Credit:EHT Collaboration
Loneliness: “the unpleasant experience that occurs when a person’s network of social relations is deficient in some important way, either quantitatively or qualitatively” (Perlman & Peplau, 1984). All of us experienced moments of loneliness, but what we don’t expect about it is that it may considerably vary, depending on quality, quantity and multidimensionality.
80% of people under 18 experienced loneliness occasionally in their life (Galanki & Vasilopoulou, 2007). This percentage varies in a U-curve pattern over the lifetime (Pinquart & Sorensen, 2001), but 15-30% of the individuals experience chronic loneliness instead (Heinrich & Gullone, 2006). What’s this variability due to? Is it possible for it to be linked to the social network extension alone?
Hawkley & Cacioppo (2010) wrote in their review: “Loneliness is synonymous with perceived social isolation, not with objective social isolation. People can live relatively solitary lives and not feel lonely, and conversely, they can live an ostensibly rich social life and feel lonely nevertheless”. When talking about perceptions, the factors to be considered become numerous, individual and subjective: personality, ethnicity, age, health status, they’re just some examples of things which can influence loneliness experience.
This multidimensionality becomes even more important when the enormous risks connected to chronic and intense loneliness are taken into consideration. It is enough to think that a premature death risk is incremented by 29% by social isolation and by 26% by perceived loneliness. This risk augmentation is even more surprising because it is comparable to the one experienced by subjects with pathological conditions, as grade 2 or 3 obesity (Holt-Lunstad, Smith, Baker, Harris & Stephenson, 2015).
This happens because, in front of a loneliness experience (be it real or subjective), numerous direct and indirect factors can compromise aspects related to physical health, sleep, physiological functioning, genic expression and immunitary system, to quote some of them (for a review: Hawkley & Cacioppo, 2010). Starting from the current conditions, the loneliness problem could become epidemic by the year 2030 (Linehan et al., 2014), although its influence is already becoming more serious in relation to the COVID-19 emergency.
Based on these premises, it is evident how important and urgent it is to define the specific factors that play an individualized role in the temporal and causal determination of experiencing loneliness. A better comprehension of the phenomenon can promote preventive and therapeutic approaches appositely tailored for the “treatment” of loneliness.
This is the direction taken in Fransenn, Stijnen, Hamers & Schneider’s study (2020): the analysis conducted on the dutch population highlighted how three different age groups (young adults, early middle-aged adults and late middle-aged adults) had different correlations between loneliness perception and the presence of various factors. For example: young adults are particularly sensitive to the frequency of contacts with their friends; early middle-aged adults perceive more loneliness if they’re unemployed; late middle-aged adults’ loneliness perception is linked to their physical health status.
The clinical implications derived from this study are crucial and consistent with the points previously illustrated: “Factors associated with loneliness across the adult life span may be understood from an age-normative life-stage perspective. Accordingly, there is no one-size-fits-all approach to reduce loneliness among adults, suggesting that a variety of interventions or an indirect approach may be necessary” (Franssen, Stijnen, Hamers & Schneider, 2020). The study results, besides enriching the theoretic framework, give a contextual frame for the tailoring of personalized interventions, be them therapeutic or preventive, for the management of the loneliness phenomenon.
We interviewed the authors of the aforementioned study, who answered ScientifiCult’s questions.
As described by Perlman & Peplau’s loneliness definition you indicated in the introduction of your research, loneliness isn’t exclusively connected to quantitative factors, but also to qualitative ones. This is also reflected in some aspects took into consideration during your study, such as ethnicity, financial status, education and psychological stress. Talking about the qualitative factors that make a network effective against loneliness (e.g.: strength, constancy, positivity, etc.), which ones do you think would be potential candidates in countering loneliness? And, according to your hypothesis, how would they be related to age?
We believe there is not one single qualitative factor that may reduce or prevent loneliness. On the contrary, all qualitative social network factors should be taken into account. We showed in our study that a broad set of factors was associated with loneliness. However, the importance of these factors may differ between individuals according to, for example age. We found that frequency of contact with friends was more strongly associated with loneliness among young adults compared to older adults. This may reflect the differences in relationships that are important to a person across the different life phases. For example, a broad social network may be important for young adults, while a smaller network with more close ties may be important for older adults.
Given the correlational nature of your study, it would not therefore be possible to determine a directionality between perceived loneliness and the factors you explored. Therefore, do you believe that interventions aimed at reducing the perceived loneliness could – at the same time – enhance the perceived quality of life and the factors you investigated? If so, which factors do you think would be better improved, in your opinion?
Individuals who feel lonely may perceive a lower quality of life. Therefore, interventions aiming to reduce loneliness may be effective in improving quality of life as well. Furthermore, interventions targeting the factors associated with loneliness may have the same effect: positively influencing the factors associated with loneliness and thereby reducing loneliness. For example, group-based physical activity interventions may not online improve health but may also reduce loneliness. On top of that, if feelings of loneliness are reduced and health is improved, this may contribute to a better quality of life as well.
In your paper, it is explained that ethnicity plays a role in the perception of loneliness. What kind of approach do you think would be more efficient to counter loneliness, when considering this factor? Would you suggest an approach based on cultural integration or one based on the formation of ethnical groups that work as a support network?
In our research paper we suggest that intervention should be developed for specific age groups. In line with this, interventions based on cultural integration may be effective for young adults, while for older adults the ethnical groups may be effective to prevent/reduce loneliness. As mentioned before, frequency of contact with friends is an important factor in relation to loneliness. Therefore, interventions based on cultural integration may help broaden and diversify the social network of young adults. In contrast to this, older migrants miss their country of origin, especially their family, more compared to younger migrants (Ciabuna, Fokkema & Nedelcu, 2016). In our study we also showed that the association between frequency of family contact and loneliness was stronger among older adults compared to young adults. Therefore, formation of ethnical groups could be effective for older adults as it provides opportunities to share memories about the country of origin.
On the basis of your results in the present study, which ones do you think could be the potential implications for loneliness management in the clinical-therapeutic practice? More specifically, how could it be adapted to the different age groups? And what kind of possible social and political interventions could be derived from these results?
We suggest, based on the results of our study, that interventions to counter loneliness should be adapted to the factors that are relevant for a specific age group. There is no one-size-fits- all approach. Awareness of these age-specific factors is a first starting point in choosing any approach to counter loneliness. This should be followed by an assessment of factors at individual level or among specific age groups, preferably by means of one-on-one conversations, to find out which factors are most relevant. This information can then be used to tailor the intervention to these factors and/or to choose appropriate implementation strategies.
A common problem in cross-sectional studies is the difference between the life experiences for the compared age groups. For example, the educational environment in which young adults get their education today is quite different from the one where elder people got their own. How important do you think these differences between life experiences in the three age groups are in influencing your research results? And in which ways was this influence shown?
In our study we did not investigate period or cohort effects on loneliness. Therefore, it is hard to say whether differences between life experiences have influenced our results. However, societal changes may influence feelings of loneliness, but every age cohort has its own difficulties. For example, young adults today experience social pressure (i.e., by social media) and stress as they pursue personal (e.g., having many friends), educational, or career goals. While 20th-century young adults had to deal with the pressure to find a partner and start a family. These differences in life experiences may mediate the factors associated with loneliness across age groups.
In your paper, a trend that negatively correlates age and psychological distress (e.g. the risk of depression) to the loneliness perception is shown. The more people get old, the less the psychological distress makes them feel lonely. How would you explain these results?
We mention that psychological distress is a factor associated with loneliness across all three age groups, because the magnitude of the association was nearly similar across the age groups.
Is there any plan to continue these studies by including a longitudinal analysis? If so, which variables and questions do you think it would be particularly interesting to examine, for such a development?
At the moment there is no plan to continue this study with longitudinal analysis. However, we are exploring if there is a possibility to perform a study to investigate the impact of the current COVID-19 pandemic on feelings of loneliness.
In the light of the recent developments related to the COVID-19 lockdown, how important do you think that the “new technologies and the ability to use them” factor has been in determining the loneliness perception for the different age groups? In which ways? Do you think this has been true even before the lockdown? Could it be true for the future as well?
What we have learned as a community from the COVID-19 lockdown is how important new technologies and the ability to use them are in staying in touch with friends, family, colleagues, etc. when face-to-face contact is impossible. We think that the young adults were more familiar with these new technologies before the lockdown than the older age groups and therefore were more inclined to use them. On the other hand, not being able to socialize with friends may have impacted young adults more than the older age groups, despite the use of technologies. Thus, new technologies and the ability to use them may certainly impact the loneliness perception although research is needed to study the exact impact.
Bibliography
Franssen, T., Stijnen, M., Hamers, F., & Schneider, F. (2020). Age differences in demographic, social and health-related factors associated with loneliness across the adult life span (19–65 years): a cross-sectional study in the Netherlands. BMC Public Health, 20(1). doi: 10.1186/s12889-020-09208-0
Galanaki, E., & Vassilopoulou, H. (2007). Teachers and children’s loneliness: A review of the literature and educational implications. European Journal of Psychology of Education,22(4), 455-475. Retrieved November 3, 2020, from http://www.jstor.org/stable/23421518
Hawkley, L., & Cacioppo, J. (2010). Loneliness Matters: A Theoretical and Empirical Review of Consequences and Mechanisms. Annals Of Behavioral Medicine, 40(2), 218-227. doi: 10.1007/s12160-010-9210-8
Heinrich, L., & Gullone, E. (2006). The clinical significance of loneliness: A literature review. Clinical Psychology Review, 26(6), 695-718. doi: 10.1016/j.cpr.2006.04.002
Holt-Lunstad, J., Smith, T., Baker, M., Harris, T., & Stephenson, D. (2015). Loneliness and Social Isolation as Risk Factors for Mortality. Perspectives On Psychological Science, 10(2), 227-237. doi: 10.1177/1745691614568352
Linehan, T., Bottery, S., Kaye, A., Millar, L., Sinclair, D., & Watson, J. (2014). 2030 vision: The best and worst futures for older people in the UK. London, England: Independent Age and International Longevity Centre-UK.
Pinquart, M., & Sorensen, S. (2001). Influences on Loneliness in Older Adults: A Meta-Analysis. Basic And Applied Social Psychology, 23(4), 245-266. doi: 10.1207/s15324834basp2304_2
UC Riverside-led research team’s model to explain photosynthesis lays out the next challenging phase of research on how green plants transform light energy into chemical energy
UC Riverside-led research team’s model to explain photosynthesis lays out the next challenging phase of research on how green plants transform light energy into chemical energy. Credits: Gabor lab, UC Riverside
When sunlight shining on a leaf changes rapidly, plants must protect themselves from the ensuing sudden surges of solar energy. To cope with these changes, photosynthetic organisms — from plants to bacteria — have developed numerous tactics. Scientists have been unable, however, to identify the underlying design principle.
An international team of scientists, led by physicist Nathaniel M. Gabor at the University of California, Riverside, has now constructed a model that reproduces a general feature of photosynthetic light harvesting, observed across many photosynthetic organisms.
Nathaniel Gabor is an associate professor of physics at UC Riverside. Credits: CIFAR
Light harvesting is the collection of solar energy by protein-bound chlorophyll molecules. In photosynthesis — the process by which green plants and some other organisms use sunlight to synthesize foods from carbon dioxide and water — light energy harvesting begins with sunlight absorption.
The researchers’ model borrows ideas from the science of complex networks, a field of study that explores efficient operation in cellphone networks, brains, and the power grid. The model describes a simple network that is able to input light of two different colors, yet output a steady rate of solar power. This unusual choice of only two inputs has remarkable consequences.
“Our model shows that by absorbing only very specific colors of light, photosynthetic organisms may automatically protect themselves against sudden changes — or ‘noise’ — in solar energy, resulting in remarkably efficient power conversion,” said Gabor, an associate professor of physics and astronomy, who led the study appearing today in the journal Science. “Green plants appear green and purple bacteria appear purple because only specific regions of the spectrum from which they absorb are suited for protection against rapidly changing solar energy.”
Gabor first began thinking about photosynthesis research more than a decade ago, when he was a doctoral student at Cornell University. He wondered why plants rejected green light, the most intense solar light. Over the years, he worked with physicists and biologists worldwide to learn more about statistical methods and the quantum biology of photosynthesis.
Richard Cogdell, a renowned botanist at the University of Glasgow in the United Kingdom and a coauthor on the research paper, encouraged Gabor to extend the model to include a wider range of photosynthetic organisms that grow in environments where the incident solar spectrum is very different.
“Excitingly, we were then able to show that the model worked in other photosynthetic organisms besides green plants, and that the model identified a general and fundamental property of photosynthetic light harvesting,” he said. “Our study shows how, by choosing where you absorb solar energy in relation to the incident solar spectrum, you can minimize the noise on the output — information that can be used to enhance the performance of solar cells.”
Coauthor Rienk van Grondelle, an influential experimental physicist at Vrije Universiteit Amsterdam in the Netherlands who works on the primary physical processes of photosynthesis, said the team found the absorption spectra of certain photosynthetic systems select certain spectral excitation regions that cancel the noise and maximize the energy stored.
“This very simple design principle could also be applied in the design of human-made solar cells,” said van Grondelle, who has vast experience with photosynthetic light harvesting.
Gabor explained that plants and other photosynthetic organisms have a wide variety of tactics to prevent damage due to overexposure to the sun, ranging from molecular mechanisms of energy release to physical movement of the leaf to track the sun. Plants have even developed effective protection against UV light, just as in sunscreen.
“In the complex process of photosynthesis, it is clear that protecting the organism from overexposure is the driving factor in successful energy production, and this is the inspiration we used to develop our model,” he said. “Our model incorporates relatively simple physics, yet it is consistent with a vast set of observations in biology. This is remarkably rare. If our model holds up to continued experiments, we may find even more agreement between theory and observations, giving rich insight into the inner workings of nature.”
To construct the model, Gabor and his colleagues applied straightforward physics of networks to the complex details of biology, and were able to make clear, quantitative, and generic statements about highly diverse photosynthetic organisms.
“Our model is the first hypothesis-driven explanation for why plants are green, and we give a roadmap to test the model through more detailed experiments,” Gabor said.
Photosynthesis may be thought of as a kitchen sink, Gabor added, where a faucet flows water in and a drain allows the water to flow out. If the flow into the sink is much bigger than the outward flow, the sink overflows and the water spills all over the floor.
“In photosynthesis, if the flow of solar power into the light harvesting network is significantly larger than the flow out, the photosynthetic network must adapt to reduce the sudden over-flow of energy,” he said. “When the network fails to manage these fluctuations, the organism attempts to expel the extra energy. In doing so, the organism undergoes oxidative stress, which damages cells.”
The researchers were surprised by how general and simple their model is.
“Nature will always surprise you,” Gabor said. “Something that seems so complicated and complex might operate based on a few basic rules. We applied the model to organisms in different photosynthetic niches and continue to reproduce accurate absorption spectra. In biology, there are exceptions to every rule, so much so that finding a rule is usually very difficult. Surprisingly, we seem to have found one of the rules of photosynthetic life.”
Gabor noted that over the last several decades, photosynthesis research has focused mainly on the structure and function of the microscopic components of the photosynthetic process.
“Biologists know well that biological systems are not generally finely tuned given the fact that organisms have little control over their external conditions,” he said. “This contradiction has so far been unaddressed because no model exists that connects microscopic processes with macroscopic properties. Our work represents the first quantitative physical model that tackles this contradiction.”
Next, supported by several recent grants, the researchers will design a novel microscopy technique to test their ideas and advance the technology of photo-biology experiments using quantum optics tools.
“There’s a lot out there to understand about nature, and it only looks more beautiful as we unravel its mysteries,” Gabor said.
Gabor, Cogdell, and van Grondelle were joined in the research by Trevor B. Arp, Jed Kistner-Morris, and Vivek Aji at UCR.
The research was supported by the Air Force Office of Scientific Research Young Investigator Program, the National Science Foundation, and through a U.S. Department of the Navy’s Historically Black Colleges and Universities/Minority Institutions award. Gabor was also supported through a Cottrell Scholar Award and a Canadian Institute for Advanced Research Azrieli Global Scholar Award. Other sources of funding were the NASA MUREP Institutional Research Opportunity program, the U.S. Department of Energy, the Biotechnological and Biological Sciences Research Council, the Royal Netherlands Academy of Arts and Sciences, and the Canadian Institute for Advanced Research.
The research paper is titled, “Quieting a noisy antenna reproduces photosynthetic light harvesting spectra.”
Press release from the University of California, Riverside
Researchers from the Hubrecht Institute in Utrecht, Erasmus MC University Medical Center Rotterdam, and Maastricht University in the Netherlands have found that the coronavirus SARS-CoV-2, which causes COVID-19, can infect cells of the intestine and multiply there. Using state-of-the-art cell culture models of the human intestine, the researchers have successfully propagated the virus in vitro, and monitored the response of the cells to the virus, providing a new cell culture model for the study of COVID-19. These findings could explain the observation that approximately one third of COVID-19 patients experience gastrointestinal symptoms such as diarrhea, and the fact that the virus often can be detected in stool samples. The results of this study were published in the scientific journal Science on the 1st of May 2020.
Patients with COVID-19 show a variety of symptoms associated with respiratory organs – such as coughing, sneezing, shortness of breath, and fever – and the disease is transmitted via tiny droplets that are spread mainly through coughing and sneezing. One third of the patients however also have gastrointestinal symptoms, such as nausea and diarrhea. In addition, the virus can be detected in human stool long after the respiratory symptoms have been resolved. This suggests that the virus can also spread via so-called “fecal-oral transmission”.
Though the respiratory and gastrointestinal organs may seem very different, there are some key similarities. A particularly interesting similarity is the presence of the ACE2 receptor, the receptor through which the COVID-19 causing SARS-CoV-2 virus can enter the cells. The inside of the intestine is loaded with ACE2 receptors. However, until now it was unknown whether intestinal cells could actually get infected and produce virus particles.
Intestinal organoids
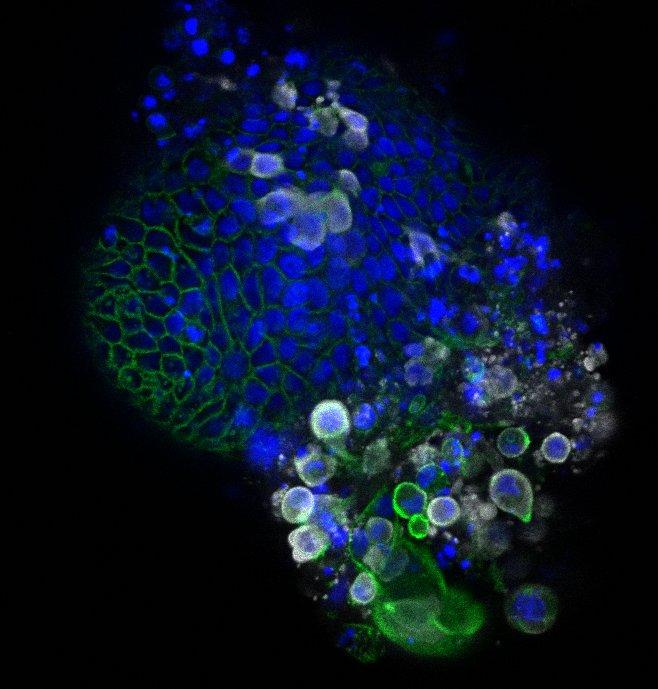
Intestinal organoid infected with coronavirus SARS-CoV-2. The coronavirus is colored white, the organoids themselves are colored blue and green. Credits: Joep Beumer, copyright: Hubrecht Institute
Researchers from the Hubrecht Institute, Erasmus MC and Maastricht University set out to determine whether the SARS-CoV-2 virus can directly infect the cells of the intestine, and if so, whether it can replicate there as well. They used human intestinal organoids: tiny versions of the human intestine that can be grown in the lab. Hans Clevers (Hubrecht Institute): “These organoids contain the cells of the human intestinal lining, making them a compelling model to investigate infection by SARS-CoV-2.”
Infection of intestinal cells
Illustration of a villus in the intestine with a zoom-in to an electron microscopy image of coronavirus SARS-CoV-2 (dark circles) at the edge of an intestinal cell. Credits: Credit: Kèvin Knoops, Raimond Ravelli and Maaike de Backer, copyright: Maastricht University
When the researchers added the virus to the organoids, they were rapidly infected. The virus enters a subset of the cells in the intestinal organoids, and the number of cells that are infected increases over time. Using electron microscopy, an advanced way to visualize different components of the cell in great detail, the researchers found virus particles inside and outside the cells of the organoids. Peter Peters (Maastricht University): “Due to the lockdown, we all studied virtual slides of the infected organoids remotely from home.”
Intestinal organoids, the right one infected with coronavirus SARS-CoV-2. The coronavirus is colored white, the organoids themselves are colored blue and green. Credits Joep Beumer, copyright Hubrecht Institute
The researchers investigated the response of the intestinal cells to the virus with RNA sequencing, a method to study which genes are active in the cells. This revealed that so-called interferon stimulated genes are activated. These genes are known to combat viral infection. Future work will focus on these genes more carefully, and on how they could be used to develop new treatments.
The researchers also cultured the organoids in different conditions that result in cells with higher and lower levels of the ACE2 receptor, through which SARS-CoV-2 can enter the cells. To their surprise, they found that the virus infected cells with both high and low levels of the ACE2 receptor. Ultimately, these studies may lead to new ways to block the entry of the virus into our cells.
Implications
Bart Haagmans (Erasmus MC): “The observations made in this study provide definite proof that SARS-CoV-2 can multiply in cells of the gastrointestinal tract. However, we don’t yet know whether SARS-CoV-2, present in the intestines of COVID-19 patients, plays a significant role in transmission. Our findings indicate that we should look into this possibility more closely.” The current study is in line with other recent studies that identified gastrointestinal symptoms in a large fraction of COVID-19 patients and virus in the stool of patients free of respiratory symptoms. Special attention may be needed for those patients with gastrointestinal symptoms. More extensive testing using not only nose and throat swabs, but also rectal swabs or stool samples may thus be needed.
In the meantime, the researchers are continuing their collaboration to learn more about COVID-19. They are studying the differences between infections in the lung and the intestine by comparing lung and intestinal organoids infected with SARS-CoV-2.
###
Publication
SARS-CoV-2 productively Infects Human Gut Enterocytes. Mart M. Lamers*, Joep Beumer*, Jelte van der Vaart*, Kèvin Knoops, Jens Puschhof, Tim I. Breugem, Raimond B.G. Ravelli, J. Paul van Schayck, Anna Z. Mykytyn, Hans Q. Duimel, Elly van Donselaar, Samra Riesebosch, Helma J.H. Kuijpers, Debby Schipper, Willine J. van de Wetering, Miranda de Graaf, Marion Koopmans, Edwin Cuppen, Peter J. Peters, Bart L. Haagmans† and Hans Clevers†. Science 2020. DOI * Equal contribution, † equal contribution.
This study was a collaboration between the Hubrecht Institute in Utrecht, the Erasmus MC University Medical Center Rotterdam, Maastricht University, the UMC Utrecht and Single Cell Discoveries in the Netherlands. The microscopy data are publicly available via the Image Data Resource (idr0083, https://idr.openmicroscopy.org – with help from the University of Dundee and the European Bioinformatics Institute) and the genomic data are publicly available via the Gene Expression Omnibus (GSE149312, https://www.ncbi.nlm.nih.gov/geo), to ensure efficient sharing of data related to COVID-19 between researchers all across the world.