Ad
Ad
Ad
Tag

Near-Infrared Spectrograph

Browsing

Webb narrows atmospheric possibilities for Earth-sized exoplanet TRAPPIST-1 d

The exoplanet TRAPPIST-1 d intrigues astronomers looking for possibly habitable worlds beyond our solar system because it is similar in size to Earth, rocky, and resides in an area around its star where liquid water on its surface is theoretically possible. But according to a new study using data from the NASA/ESA/CSA James Webb Space Telescope, it does not have an Earth-like atmosphere.

A protective atmosphere, a friendly Sun, and lots of liquid water — Earth is a special place. Using the unprecedented capabilities of the Webb, astronomers are on a mission to determine just how special, and rare, our home planet is. Can this temperate environment exist elsewhere, even around a different type of star? The TRAPPIST-1 system provides a tantalizing opportunity to explore this question, as it contains seven Earth-sized worlds orbiting the most common type of star in the galaxy: a red dwarf.

“Ultimately, we want to know if something like the environment we enjoy on Earth can exist elsewhere, and under what conditions. While the James Webb Space Telescope is giving us the ability to explore this question in Earth-sized planets for the first time, at this point we can rule out TRAPPIST-1 d from a list of potential Earth twins or cousins,”

said Caroline Piaulet-Ghorayeb of the University of Chicago and Trottier Institute for Research on Exoplanets (IREx) at Université de Montréal, lead author of the study published in The Astrophysical Journal.

Planet TRAPPIST-1 d

The TRAPPIST-1 system is located 40 light-years away and was revealed as the record-holder for most Earth-sized rocky planets around a single star in 2017, thanks to data from NASA’s retired Spitzer Space Telescope and other observatories. Due to that star being a dim, relatively cold red dwarf, the “habitable zone” – where the planet’s temperature may be just right, such that liquid surface water is possible – lies much closer to the star than in our solar system. TRAPPIST-1 d, the third planet from the red dwarf star, lies on the cusp of that temperate zone, yet its distance to its star is only 2 percent of Earth’s distance from the Sun. TRAPPIST-1 d completes an entire orbit around its star, its year, in only four Earth days.

Webb’s NIRSpec (Near-Infrared Spectrograph) instrument did not detect molecules from TRAPPIST-1 d that are common in Earth’s atmosphere, like water, methane, or carbon dioxide. However, Piaulet-Ghorayeb outlined several possibilities for the exoplanet that remain open for follow-up study.

“There are a few potential reasons why we don’t detect an atmosphere around TRAPPIST-1 d. It could have an extremely thin atmosphere that is difficult to detect, somewhat like Mars. Alternatively, it could have very thick, high-altitude clouds that are blocking our detection of specific atmospheric signatures — something more like Venus. Or, it could be a barren rock, with no atmosphere at all,” Piaulet-Ghorayeb said.

The star TRAPPIST-1

No matter what the case may be for TRAPPIST-1 d, it’s tough being a planet in orbit around a red dwarf star. TRAPPIST-1, the host star of the system, is known to be volatile, often releasing flares of high-energy radiation with the potential to strip off the atmospheres of its small planets, especially those orbiting most closely. Nevertheless, scientists are motivated to seek signs of atmospheres on the TRAPPIST-1 planets because red dwarf stars are the most common stars in our galaxy. If planets can hold on to an atmosphere here, under waves of harsh stellar radiation, they could, as the saying goes, make it anywhere.

“Webb’s sensitive infrared instruments are allowing us to delve into the atmospheres of these smaller, colder planets for the first time,” said Björn Benneke of IREx at Université de Montréal, a co-author of the study. “We’re really just getting started using Webb to look for atmospheres on Earth-sized planets, and to define the line between planets that can hold onto an atmosphere, and those that cannot.”

The outer TRAPPIST-1 planets

Webb observations of the outer TRAPPIST-1 planets are ongoing, which hold both potential and peril. On the one hand, Benneke said, planets e, f, g, and h may have better chances of having atmospheres because they are further away from the energetic eruptions of their host star. However, their distance and colder environment will make atmospheric signatures more difficult to detect, even with Webb’s infrared instruments.

“All hope is not lost for atmospheres around the TRAPPIST-1 planets,” Piaulet-Ghorayeb said. “While we didn’t find a big, bold atmospheric signature at planet d, there is still potential for the outer planets to be holding onto a lot of water and other atmospheric components.”

Our detective work is just beginning. While TRAPPIST-1 d may prove a barren rock illuminated by a cruel red star, the outer planets TRAPPIST-1e, f, g, and h, may yet possess thick atmospheres,” added Ryan MacDonald, a co-author of the paper, now at the University of St Andrews in the United Kingdom, and previously at the University of Michigan. “Thanks to Webb we now know that TRAPPIST-1 d is a far cry from a hospitable world. We’re learning that the Earth is even more special in the cosmos.”

Illustration of a planet silhouetted in front of a star. The star shows a large eruption on one side and more wisps of red coming from its southern hemisphere. Two more planets appear in the background.
The James Webb Space Telescope narrows atmospheric possibilities for Earth-sized rocky exoplanet TRAPPIST-1 d. This artist’s concept depicts planet TRAPPIST-1 d passing in front of its turbulent star, with other members of the closely packed system shown in the background.
The TRAPPIST-1 system is intriguing to scientists for a few reasons. Not only does the system have seven Earth-sized rocky worlds, but its star is a red dwarf, the most common type of star in the Milky Way galaxy. If an Earth-sized world can maintain an atmosphere here, and thus have the potential for liquid surface water, the chance of finding similar worlds throughout the galaxy is much higher. In studying the TRAPPIST-1 planets, scientists are determining the best methods for separating starlight from potential atmospheric signatures in data from the NASA/ESA/CSA James Webb Space Telescope. The star TRAPPIST-1’s variability, with frequent flares, provides a challenging testing ground for these methods.
Credit: NASA, ESA, CSA, J. Olmsted (STScI)

Bibliographic information:

Caroline Piaulet-Ghorayeb et al.,  ApJ 989 181 2025, DOI: 10.3847/1538-4357/adf207


Press release from ESA Webb.

Webb discovers the incredibly distant galaxy JADES-GS-z13-1 in mysteriously clearing fog of early Universe

Using the unique infrared sensitivity of the NASA/ESA/CSA James Webb Space Telescope, researchers can examine ancient galaxies to probe secrets of the early universe. Now, an international team of astronomers has identified bright hydrogen emission from a galaxy in an unexpectedly early time in the Universe’s history. The surprise finding is challenging researchers to explain how this light could have pierced the thick fog of neutral hydrogen that filled space at that time.

A small, zoomed-in area of deep space. Numerous galaxies in various shapes are visible, most of them small, but two are quite large and glow brightly. In the very centre is a small red dot, an extremely faraway galaxy. Two lines of light enter the left side: these are diffraction spikes, visual artefacts, caused by a nearby bright star just out of view.
The incredibly distant galaxy GS-z13-1, observed just 330 million years after the Big Bang, was initially discovered with deep imaging from the NASA/ESA/CSA James Webb Space Telescope. Now, an international team of astronomers has definitively identified powerful hydrogen emission from this galaxy at an unexpectedly early period in the Universe’s history, a probable sign that we are seeing some of the first hot stars from the dawn of the Universe. This image shows the galaxy GS-z13-1 (the red dot at centre), imaged with Webb’s Near-Infrared Camera (NIRCam) as part of the JWST Advanced Deep Extragalactic Survey (JADES) programme. These data from NIRCam allowed researchers to identify GS-z13-1 as an incredibly distant galaxy, and to put an estimate on its redshift value. Webb’s unique infrared sensitivity is necessary to observe galaxies at this extreme distance, whose light has been redshifted into infrared wavelengths during its long journey across the cosmos.
To confirm the galaxy’s redshift, the team turned to Webb’s Near-Infrared Spectrograph (NIRSpec) instrument. With new observations permitting advanced spectroscopy of the galaxy’s emitted light, the team not only confirmed GS-z13-1’s redshift of 13.0, they also revealed the strong presence of a type of ultraviolet radiation called Lyman-α emission. This is a telltale sign of the presence of newly forming stars, or a possible active galactic nucleus in the galaxy, but at a much earlier time than astronomers had thought possible. The result holds great implications for our understanding of the Universe.
Credit: ESA/Webb, NASA, STScI, CSA, JADES Collaboration, Brant Robertson (UC Santa Cruz), Ben Johnson (CfA), Sandro Tacchella (Cambridge), Phill Cargile (CfA), J. Witstok, P. Jakobsen, A. Pagan (STScI), M. Zamani (ESA/Webb)

A key science goal of the NASA/ESA/CSA James Webb Space Telescope has been to see further than ever before into the distant past of our Universe, when the first galaxies were forming after the Big Bang. This search has already yielded record-breaking galaxies, in observing programmes such as the JWST Advanced Deep Extragalactic Survey (JADES). Webb’s extraordinary sensitivity to infrared light also opens entirely new avenues of research into when and how such galaxies formed, and their effects on the Universe at the time known as cosmic dawn. Researchers studying one of those very early galaxies have now made a discovery in the spectrum of its light, that challenges our established understanding of the Universe’s early history.

Webb discovered the incredibly distant galaxy JADES-GS-z13-1, observed to be at just 330 million years after the Big Bang, in images taken by Webb’s NIRCam (Near-Infrared Camera) as part of the JADES programme. Researchers used the galaxy’s brightness in different infrared filters to estimate its redshift, which measures a galaxy’s distance from Earth based on how its light has been stretched out during its journey through expanding space.

The spectrum of light from the distant galaxy JADES-GS-z13-1 is graphed as a line from left (lower wavelengths) to right (higher wavelengths). The line rises where a wavelength in the spectrum is brighter, and falls where it is dimmer. A vertical red line labelled “Lyman-alpha emission z=13.05” marks a wavelength in the spectrum where there is a noticeable spike in brightness. The graph is labelled “NIRSpec | PRISM”.
The incredibly distant galaxy GS-z13-1, observed just 330 million years after the Big Bang, was initially discovered with deep imaging from the NASA/ESA/CSA James Webb Space Telescope. Now, an international team of astronomers has definitively identified powerful hydrogen emission from this galaxy at an unexpectedly early period in the Universe’s history, a probable sign that we are seeing some of the first hot stars from the dawn of the Universe. Data from NIRCam allowed researchers to identify GS-z13-1 as an incredibly distant galaxy, and to put an estimate on its redshift value. Webb’s unique infrared sensitivity is necessary to observe galaxies at this extreme distance, whose light has been redshifted into infrared wavelengths during its long journey across the cosmos.
To confirm the galaxy’s redshift, the team turned to Webb’s Near-Infrared Spectrograph (NIRSpec) instrument. This graphic shows the light from galaxy GS-z13-1, dispersed by NIRSpec into its component near-infrared wavelengths. This graphic indicates very bright Lyman-α emission from the galaxy, which has been redshifted to an infrared wavelength. Not only does this emission in GS-z13-1’s spectrum confirm the galaxy’s extreme redshift, it is a telltale sign of the presence of newly forming stars, or a possible active galactic nucleus in the galaxy. Appearing at a much earlier time than astronomers had thought possible, the discovery of this Lyman-α emission holds great implications for our understanding of the Universe.
Credit: ESA/Webb, NASA, CSA, STScI, J. Olmsted (STScI), S. Carniani (Scuola Normale Superiore), P. Jakobsen

The NIRCam imaging yielded an initial redshift estimate of 12.9. Seeking to confirm its extreme redshift, an international team led by Joris Witstok of the University of Cambridge in the United Kingdom as well as the Cosmic Dawn Center and the University of Copenhagen in Denmark, then observed the galaxy using Webb’s Near-Infrared Spectrograph (NIRSpec) instrument.

An area of deep space is covered by a scattering of galaxies in many shapes and in colours ranging from blue to whitish to orange, as well as a few nearby stars. A very small square is shown zoomed in, in a box to the left. In the centre a red dot, a faraway galaxy, is marked out by lines and labelled “Redshift (z)=13”, signifying its extreme distance. Two much larger galaxies are labelled “z=0.63” and “z=0.70”. The box is titled “JADES-GS-z13-1”.
The incredibly distant galaxy GS-z13-1, observed just 330 million years after the Big Bang, was initially discovered with deep imaging from the NASA/ESA/CSA James Webb Space Telescope. Now, an international team of astronomers has definitively identified powerful hydrogen emission from this galaxy at an unexpectedly early period in the Universe’s history, a probable sign that we are seeing some of the first hot stars from the dawn of the Universe. This image shows the location of the galaxy GS-z13-1 in the GOODS-S field, as well as the galaxy itself, imaged with Webb’s Near-Infrared Camera (NIRCam) as part of the JWST Advanced Deep Extragalactic Survey (JADES) programme. These data from NIRCam allowed researchers to identify GS-z13-1 as an incredibly distant galaxy, and to put an estimate on its redshift value. Webb’s unique infrared sensitivity is necessary to observe galaxies at this extreme distance, whose light has been redshifted into infrared wavelengths during its long journey across the cosmos.
To confirm the galaxy’s redshift, the team turned to Webb’s Near-Infrared Spectrograph (NIRSpec) instrument. With new observations permitting advanced spectroscopy of the galaxy’s emitted light, the team not only confirmed GS-z13-1’s redshift of 13.0, they also revealed the strong presence of a type of ultraviolet radiation called Lyman-α emission. This is a telltale sign of the presence of newly forming stars, or a possible active galactic nucleus in the galaxy, but at a much earlier time than astronomers had thought possible. The result holds great implications for our understanding of the Universe.
Credit: ESA/Webb, NASA, STScI, CSA, JADES Collaboration, Brant Robertson (UC Santa Cruz), Ben Johnson (CfA), Sandro Tacchella (Cambridge), Phill Cargile (CfA), J. Witstok, P. Jakobsen, A. Pagan (STScI), M. Zamani (ESA/Webb)

In the resulting spectrum, the redshift was confirmed to be 13.0. This equates to a galaxy seen just 330 million years after the Big Bang, a small fraction of the Universe’s present age of 13.8 billion years old. But an unexpected feature stood out as well: one specific, distinctly bright wavelength of light, identified as the Lyman-α emission radiated by hydrogen atoms.[1] This emission was far stronger than astronomers thought possible at this early stage in the Universe’s development.

The early Universe was bathed in a thick fog of neutral hydrogen,” explained Roberto Maiolino, a team member from the University of Cambridge and University College London. “Most of this haze was lifted in a process called reionisation, which was completed about one billion years after the Big Bang. GS-z13-1 is seen when the Universe was only 330 million years old, yet it shows a surprisingly clear, telltale signature of Lyman-α emission that can only be seen once the surrounding fog has fully lifted. This result was totally unexpected by theories of early galaxy formation and has caught astronomers by surprise.”

Before and during the epoch of reionisation [2], the immense amounts of neutral hydrogen fog surrounding galaxies blocked any energetic ultraviolet light they emitted, much like the filtering effect of coloured glass. Until enough stars had formed and were able to ionise the hydrogen gas, no such light — including Lyman-α emission — could escape from these fledgling galaxies to reach Earth. The confirmation of Lyman-α radiation from this galaxy, therefore, has great implications for our understanding of the early Universe. Team member Kevin Hainline of the University of Arizona in the United States, says

We really shouldn’t have found a galaxy like this, given our understanding of the way the Universe has evolved. We could think of the early Universe as shrouded with a thick fog that would make it exceedingly difficult to find even powerful lighthouses peeking through, yet here we see the beam of light from this galaxy piercing the veil. This fascinating emission line has huge ramifications for how and when the Universe reionised.

The source of the Lyman-α radiation from this galaxy is not yet known, but it is may include the first light from the earliest generation of stars to form in the Universe. Witstok elaborates:

The large bubble of ionised hydrogen surrounding this galaxy might have been created by a peculiar population of stars — much more massive, hotter and more luminous than stars formed at later epochs, and possibly representative of the first generation of stars”.

A powerful active galactic nucleus (AGN) [3], driven by one of the first supermassive black holes, is another possibility identified by the team.

The new results could not have been obtained without the incredible near-infrared sensitivity of Webb, necessary not only to find such distant galaxies but also to examine their spectra in fine detail. Former NIRSpec Project Scientist, Peter Jakobsen of the Cosmic Dawn Center and the University of Copenhagen in Denmark, recalls:

“Following in the footsteps of the Hubble Space Telescope, it was clear Webb would be capable of finding ever more distant galaxies. As demonstrated by the case of GS-z13-1, however, it was always going to be a surprise what it might reveal about the nature of the nascent stars and black holes that are formed at the brink of cosmic time.”

The team plans further follow-up observations of GS-z13-1, aiming to obtain more information about the nature of this galaxy and origin of its strong Lyman-α radiation. Whatever the galaxy is concealing, it is certain to illuminate a new frontier in cosmology.

This new research has been published today in Nature. The data for this result were captured as part of JADES under JWST programmes #1180 (PI: D. J. Eisenstein), #1210, #1286 and #1287 (PI: N. Luetzgendorf), and the JADES Origin Field programme #3215 (PIs: Eisenstein and R. Maiolino).

An area of deep space is covered by a scattering of galaxies in many shapes and in colours ranging from blue to whitish to orange, as well as a few nearby stars. A very small square is shown zoomed in, in a box to the left. In the centre a red dot, a faraway galaxy, is the featured galaxy JADES-GS-z13-1.
The incredibly distant galaxy JADES-GS-z13-1, observed just 330 million years after the Big Bang, was initially discovered with deep imaging from the NASA/ESA/CSA James Webb Space Telescope. Now, an international team of astronomers has definitively identified powerful hydrogen emission from this galaxy at an unexpectedly early period in the Universe’s history, a probable sign that we are seeing some of the first hot stars from the dawn of the Universe. This image shows the location of the galaxy GS-z13-1 in the GOODS-S field, as well as the galaxy itself, imaged with Webb’s Near-Infrared Camera (NIRCam) as part of the JWST Advanced Deep Extragalactic Survey (JADES) programme. These data from NIRCam allowed researchers to identify GS-z13-1 as an incredibly distant galaxy, and to put an estimate on its redshift value. Webb’s unique infrared sensitivity is necessary to observe galaxies at this extreme distance, whose light has been redshifted into infrared wavelengths during its long journey across the cosmos.
To confirm the galaxy’s redshift, the team turned to Webb’s Near-Infrared Spectrograph (NIRSpec) instrument. With new observations permitting advanced spectroscopy of the galaxy’s emitted light, the team not only confirmed GS-z13-1’s redshift of 13.0, they also revealed the strong presence of a type of ultraviolet radiation called Lyman-α emission. This is a telltale sign of the presence of newly forming stars, or a possible active galactic nucleus in the galaxy, but at a much earlier time than astronomers had thought possible. The result holds great implications for our understanding of the Universe.
Credit: ESA/Webb, NASA & CSA, JADES Collaboration, J. Witstok, P. Jakobsen, A. Pagan (STScI), M. Zamani (ESA/Webb)

Notes

[1] The name comes from the fact that a hydrogen atom emits a characteristic wavelength of light, known as “Lyman-alpha” radiation, that is produced when its electron drops from the second-lowest to the lowest orbit around the nucleus (energy level).

[2] The epoch of reionisation was a very early stage in the Universe’s history that took place after recombination (the first stage following the Big Bang). During recombination, the Universe cooled enough that electrons and protons began to combine to form neutral hydrogen atoms. Reionisation began when denser clouds of gas started to form, creating stars and eventually entire galaxies. They produced large amounts of ultraviolet photons, which gradually reionised the hydrogen gas. As neutral hydrogen gas is opaque to energetic ultraviolet light, we can only see galaxies during this epoch at longer wavelengths until they create a “bubble” of ionised gas around them, so that their ultraviolet light can escape through it and reach us.

[3] An active galactic nucleus is a region of extremely strong radiation at the centre of a galaxy. It is fuelled by an accretion disc, made of material orbiting and falling into a central supermassive black hole. The material crashes together as it spins around the black hole, heating to such extreme temperatures that it radiates highly energetic ultraviolet light and even X-rays, rivalling the brightness of the whole galaxy surrounding it.


Press release from ESA Webb.

Webb captures Neptune’s auroras for the first time

For the first time, the NASA/ESA/CSA James Webb Space Telescope has captured bright auroral activity on Neptune. Auroras occur when energetic particles, often originating from the Sun, become trapped in a planet’s magnetic field and eventually strike the upper atmosphere. The energy released during these collisions creates the signature glow.

In the past, astronomers have seen tantalizing hints of auroral activity on Neptune. However, imaging and confirming the auroras on Neptune has long evaded astronomers despite successful detections on Jupiter, Saturn, and Uranus. Neptune was the missing piece of the puzzle when it came to detecting auroras on the giant planets of our Solar System. Now, Webb’s near-infrared sensitivity has observed this phenomenon.

The data was obtained in June 2023 using Webb’s Near-Infrared Spectrograph. In addition to the image of the planet, astronomers obtained a spectrum to characterise the composition and measure the temperature of the planet’s upper atmosphere (the ionosphere). For the first time, they found an extremely prominent emission line [1] signifying the presence of the trihydrogen cation (H3+), which can be created in auroras. In the Webb images of Neptune, the glowing aurora appears as splotches represented in cyan.

The auroral activity seen on Neptune is noticeably different from what we are accustomed to seeing here on Earth, or even Jupiter or Saturn. Instead of being confined to the planet’s northern and southern poles, Neptune’s auroras are located at the planet’s geographic mid-latitudes — think where South America is located on Earth.

This is due to the strange nature of Neptune’s magnetic field, originally discovered by NASA’s Voyager 2 in 1989, which is tilted by 47 degrees from the planet’s rotation axis. Since auroral activity is based where the magnetic fields converge into the planet’s atmosphere, Neptune’s auroras are far from its rotational poles.

The ground-breaking detection of Neptune’s auroras will help us understand how Neptune’s magnetic field interacts with particles that stream out from the Sun to the distant reaches of our solar system, a totally new window in ice giant atmospheric science.

From the Webb observations, the science team also measured the temperature of the top of Neptune’s atmosphere for the first time since Voyager 2’s flyby. The results hint at why Neptune’s auroras remained hidden from astronomers for so long: Neptune’s upper atmosphere has cooled by several hundreds of degrees.

Through the years, astronomers have predicted the intensity of Neptune’s auroras based on the temperature recorded by Voyager 2. A substantially colder temperature would result in much fainter auroras. This cold temperature is likely the reason that Neptune’s auroras have remained undetected for so long. The dramatic cooling also suggests that this region of the atmosphere can change greatly even though the planet sits over 30 times farther from the Sun compared to Earth.

Equipped with these new findings, astronomers now hope to study Neptune with Webb over a full solar cycle, an 11-year period of activity driven by the Sun’s magnetic field. Results could provide insights into the origin of Neptune’s bizarre magnetic field, and even explain why it’s so tilted.

These observations were obtained as part of Guaranteed Time Observations in programme 1249 (PI: L. Fletcher). The team’s results have been published in Nature Astronomy.

Notes

[1] A bright line in a spectrum caused by emission of light. Each chemical element emits and absorbs radiated energy at specific wavelengths. The collection of emission lines in a spectrum corresponds to the chemical elements contained in a celestial object.

A two-panel horizontal image. On the left is Neptune observed by the Hubble Space Telescope. It is a blue circle, tilted about 25 degrees to the left. There are white smudges at 7 o’clock and just above 5 o’clock. At right is an opposing view of the planet, using data from Hubble and Webb. It is a multi-hued blue orb. There are white smudges in the same spots as the image on the left, but also at the center of the planet and at the top. There are cyan smudges vertically along the right side, and the top of these areas are more translucent than the bottom.
At the left, an enhanced-color image of Neptune from the NASA/ESA Hubble Space Telescope. At the right, that image is combined with data from the NASA/ESA/CSA James Webb Space Telescope. The cyan splotches, which represent auroral activity, and white clouds, are data from Webb’s Near-Infrared Spectrograph (NIRSpec), overlaid on top of the full image of the planet from Hubble’s Wide Field Camera 3. Auroras occur when energetic particles, often originating from the Sun, become trapped in a planet’s magnetic field and eventually strike the upper atmosphere. The energy released during these collisions creates the signature glow. Webb’s detection of auroras on Neptune is the first time astronomers have captured direct evidence of this phenomenon on the planet most distant from the Sun. In addition to the visible glow in the imagery, the spectrum from Webb also found an extremely prominent emission line signifying the presence of the trihydrogen cation (H3+), which can be created in auroras.
Neptune’s auroras do not occur at the northern and southern poles of the planet, where we see auroras on planets like Earth and Jupiter, because of the strange nature of Neptune’s magnetic field, which is tilted by 47 degrees from the planet’s rotational axis. Webb’s study of Neptune also revealed that the planet’s upper atmosphere has cooled by several hundred degrees, likely the reason that Neptune’s auroras have remained undetected for so long. This image was created from Hubble and Webb data from proposals: 17187 (R. Windhorst) and 1249 (B. Frye).
Credit: NASA, ESA, CSA, STScI, Heidi Hammel (AURA), Henrik Melin (Northumbria University), Leigh Fletcher (University of Leicester), Stefanie Milam (NASA-GSFC)

Press release from ESA Webb.

Webb exposes complex atmosphere of SIMP 0136, a starless super-Jupiter

An international team of researchers has discovered that previously observed variations in brightness across a free-floating planetary-mass object known as SIMP 0136 must be the result of a complex combination of atmospheric factors, and cannot be explained by clouds alone.

Using the NASA/ESA/CSA James Webb Space Telescope to monitor a broad spectrum of infrared light emitted by SIMP 0136 over two full rotation periods, the team was able to detect variations in cloud layers, temperature, and carbon chemistry that were previously hidden from view. The results provide crucial insight into the three-dimensional complexity of gas giant atmospheres within and beyond our solar system.

Rapidly rotating, free-floating

SIMP 0136 is a rapidly rotating, free-floating object roughly 13 times the mass of Jupiter, located in the Milky Way just 20 light-years from Earth. Although it is not classified as a gas giant exoplanet — it doesn’t orbit a star and may instead be a brown dwarf — SIMP 0136 is an ideal target for exo-meteorology: It is the brightest object of its kind in the northern sky. Because it is isolated, it can be observed directly and with no fear of light contamination or variability caused by a host star. And its short rotation period of just 2.4 hours makes it possible to survey very efficiently.

Prior to the Webb observations, SIMP 0136 had been studied extensively using ground-based observatories, as well as and NASA’s Spitzer Space Telescope and the NASA/ESA Hubble Space Telescope.

“We already knew that it varies in brightness, and we were confident that there are patchy cloud layers that rotate in and out of view and evolve over time,” explained Allison McCarthy, doctoral student at Boston University and lead author on a study published today in The Astrophysical Journal Letters“We also thought there could be temperature variations, chemical reactions, and possibly some effects of auroral activity affecting the brightness, but we weren’t sure.”

To figure it out, the team needed Webb’s ability to measure very precise changes in brightness over a broad range of wavelengths.

Charting thousands of infrared rainbows

Using NIRSpec (Near-Infrared Spectrograph), Webb captured thousands of individual 0.6- to 5.3-micron spectra — one every 1.8 seconds over more than three hours as the object completed one full rotation. This was immediately followed by an observation with MIRI (Mid-Infrared Instrument), which collected hundreds of measurements of 5- to 14-micron light — one every 19.2 seconds, over another rotation.

The result was hundreds of detailed light curves, each showing the change in brightness of a very precise wavelength (color) as different sides of the object rotated into view.

“To see the full spectrum of this object change over the course of minutes was incredible,” said principal investigator Johanna Vos, from Trinity College Dublin. “Until now, we only had a little slice of the near-infrared spectrum from Hubble, and a few brightness measurements from Spitzer.”

The team noticed almost immediately that there were several distinct light-curve shapes. At any given time, some wavelengths were growing brighter, while others were becoming dimmer or not changing much at all. A number of different factors must be affecting the brightness variations.

“Imagine watching Earth from far away. If you were to look at each color separately, you would see different patterns that tell you something about its surface and atmosphere, even if you couldn’t make out the individual features,” explained co-author Philip Muirhead, also from Boston University. “Blue would increase as oceans rotate into view. Changes in brown and green would tell you something about soil and vegetation.”

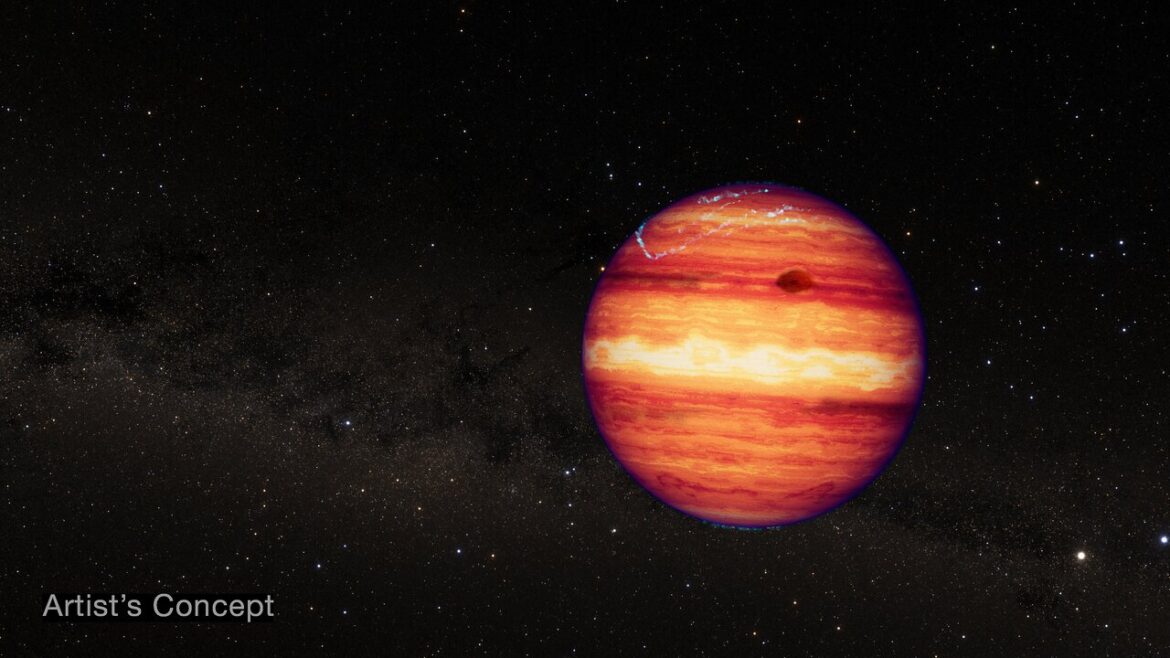
Illustration of a gas giant planet or brown dwarf on a background of distant stars.
This artist’s concept shows what the isolated planetary-mass object SIMP 0136 could look like based on recent observations from the NASA/ESA/CSA James Webb Space Telescope.
SIMP 0136 has a mass about 13 times that of Jupiter. Although it is thought to have the structure and composition of a gas giant, it is not technically classified as an exoplanet because it doesn’t orbit its own star.
The colors shown in the illustration represent near-infrared light, which is invisible to human eyes. SIMP 0136 is relatively warm — about 825 degrees Celsius or 1,100 kelvins — but is not hot enough to give off enough visible light to see from Earth, and is not illuminated by a host star. The bluish glow near the poles represents auroral energy (light given off by electrons spiraling in a magnetic field) which has been detected at radio wavelengths.
Researchers used NIRSpec (Near-infrared Spectrograph) and MIRI (Mid-Infrared Instrument) to monitor the brightness of SIMP 0136 over two full rotations in July 2023. By analyzing the change in brightness of different wavelengths over time, researchers were able to detect variability in cloud cover at different depths, temperature variations in the high atmosphere, and changes in carbon chemistry as different sides of the object rotated in and out of view.
SIMP 0136 is located within the Milky Way, about 20 light-years from Earth, in the constellation Pisces. It is the brightest isolated planet or brown dwarf visible from the Northern Hemisphere, and is thought to be about 200 million years old. This illustration is based on spectroscopic observations. Webb has not captured a direct image of the object.
Credit: NASA, ESA, CSA, J. Olmsted (STScI)

Patchy clouds, hot spots, and carbon chemistry

To figure out what could be causing the variability on SIMP 0136, the team used atmospheric models to show where in the atmosphere each wavelength of light was originating.

“Different wavelengths provide information about different depths in the atmosphere,” explained McCarthy. “We started to realize that the wavelengths that had the most similar light-curve shapes also probed the same depths, which reinforced this idea that they must be caused by the same mechanism.”

One group of wavelengths, for example, originates deep in the atmosphere where there could be patchy clouds made of iron particles. A second group comes from higher clouds thought to be made of tiny grains of silicate minerals. The variations in both of these light curves are related to patchiness of the cloud layers.

A third group of wavelengths originates at very high altitude, far above the clouds, and seems to track temperature. Bright “hot spots” could be related to auroras that were previously detected at radio wavelengths, or to upwelling of hot gas from deeper in the atmosphere.

Some of the light curves cannot be explained by either clouds or temperature, but instead show variations related to atmospheric carbon chemistry. There could be pockets of carbon monoxide and carbon dioxide rotating in and out of view, or chemical reactions causing the atmosphere to change.

“We haven’t really figured out the chemistry part of the puzzle yet,” said Vos. “But these results are really exciting because they are showing us that the abundances of molecules like methane and carbon dioxide could change from place to place and over time. If we are looking at an exoplanet and can get only one measurement, we need to consider that it might not be representative of the entire planet.”

This research was conducted as part of Webb’s General Observer (GO) Program 3548.

Bibliographic information:

Allison M. McCarthy et al 2025, ApJL 981 L22, DOI: 10.3847/2041-8213/ad9eaf

The graphic has two parts. On the left are light curves showing the change in brightness of three sets of near-infrared wavelengths over time. On the right is a cross-section of the object’s atmosphere, showing the altitude that each set of wavelengths originates and their relationship to cloud layers or temperature.
These light curves show the change in brightness of three different sets of wavelengths (colors) of near-infrared light coming from the isolated planetary-mass object SIMP 0136 as it rotated. The light was captured by Webb’s NIRSpec (Near-Infrared Spectrograph), which collected a total of 5,726 spectra — one every 1.8 seconds — over the course of about 3 hours on 23 July 2023 (SIMP 0136 completes one rotation every 2.4 hours).
By comparing these light curves to models, researchers were able to show that each set of wavelengths probes different depths (pressures) in the atmosphere.
The curve shown in red tracks the brightness of 0.9- to 1.4-micron light thought to originate deep in the atmosphere at a pressure of about 10 bars (about 10 times the air pressure at sea level on Earth), within clouds made of iron particles. The curve shown in yellow tracks the brightness of 1.4- to 2.3-micron light from a pressure of about 1 bar within higher clouds made of tiny grains of silicate minerals. The variations in brightness shown by these two curves is related to patchiness of the cloud layers, which emit some wavelengths of light and absorb others.
The curve shown in blue tracks the brightness of 3.3- to 3.6-micron light that originates high above the clouds at a pressure of about 0.1 bars. Changes in brightness of these wavelengths are related to variations in temperature around the object. Bright “hot spots” could be related to auroras that have been detected at radio wavelengths, or to upwelling of hot gas from deeper in the atmosphere.
The differences in shape of these three light curves show that there are complex variations in SIMP 0136’s atmosphere with depth as well as longitude. If the atmosphere varied around the object in the same way at all depths, the light curves would have similar patterns. If it varied with depth, but not longitude, the light curves would be straight, flat lines.
Note this graph shows the relative change in brightness for each given set of wavelengths over time, not the difference in absolute brightness between the different sets. At any given time, there is more light coming from the deep atmosphere (red light curve) than from the upper atmosphere (blue light curve).
SIMP 0136 is located within the Milky Way, about 20 light-years from Earth, in the constellation Pisces. It is the brightest isolated planet or brown dwarf visible from the Northern Hemisphere, and is thought to be about 200 million years old. The artist’s concepts are based on spectroscopic observations. Webb has not captured a direct image of the object.
Credit: NASA, ESA, CSA, J. Olmsted (STScI)

Press release from ESA Webb.
Massive black hole in the early universe spotted taking a ‘nap’ after overeating, and lying dormant in its host galaxy, GN-1001830

JWST buco nero dormiente GN-1001830 Illustrazione artistica che rappresenta l'aspetto potenziale del buco nero supermassiccio scoperto dal team di ricerca durante la sua fase di intensa attività super-Eddington. Crediti: Jiarong Gu
A study in Nature finds that black holes in the early Universe go through short periods of ultra-fast growth, followed by long periods of dormancy. Picture credits: Jiarong Gu

Scientists have spotted a massive black hole in the early universe that is ‘napping’ after stuffing itself with too much food.

Like a bear gorging itself on salmon before hibernating for the winter, or a much-needed nap after Christmas dinner, this black hole has overeaten to the point that it is lying dormant in its host galaxy, GN-1001830.

An international team of astronomers, led by the University of Cambridge, used the NASA/ESA/CSA James Webb Space Telescope to detect this black hole in the early universe, just 800 million years after the Big Bang.

The black hole is huge – 400 million times the mass of our Sun – making it one of the most massive black holes discovered by Webb at this point in the universe’s development. The black hole is so enormous that it makes up roughly 40% of the total mass of its host galaxy: in comparison, most black holes in the local universe are roughly 0.1% of their host galaxy mass.

However, despite its gigantic size, this black hole is eating, or accreting, the gas it needs to grow at a very low rate – about 100 times below its theoretical maximum limit – making it essentially dormant.

Such an over-massive black hole so early in the universe, but one that isn’t growing, challenges existing models of how black holes develop. However, the researchers say that the most likely scenario is that black holes go through short periods of ultra-fast growth, followed by long periods of dormancy. Their results are reported in the journal Nature.

When black holes are ‘napping’, they are far less luminous, making them more difficult to spot, even with highly-sensitive telescopes such as Webb. Black holes cannot be directly observed, but instead they are detected by the tell-tale glow of a swirling accretion disc, which forms near the black hole’s edges. The gas in the accretion disc becomes extremely hot and starts to glow and radiate energy in the ultraviolet range.

“Even though this black hole is dormant, its enormous size made it possible for us to detect,” said lead author Ignas Juodžbalis from Cambridge’s Kavli Institute for Cosmology. “Its dormant state allowed us to learn about the mass of the host galaxy as well. The early universe managed to produce some absolute monsters, even in relatively tiny galaxies.”

According to standard models, black holes form from the collapsed remnants of dead stars and accrete matter up to a predicted limit, known as the Eddington limit, where the pressure of radiation on matter overcomes the gravitational pull of the black hole. However, the sheer size of this black hole suggests that standard models may not adequately explain how these monsters form and grow.

“It’s possible that black holes are ‘born big’, which could explain why Webb has spotted huge black holes in the early universe,” said co-author Professor Roberto Maiolino, from the Kavli Institute and Cambridge’s Cavendish Laboratory. “But another possibility is they go through periods of hyperactivity, followed by long periods of dormancy.”

Working with colleagues from Italy, the Cambridge researchers conducted a range of computer simulations to model how this dormant black hole could have grown to such a massive size so early in the universe. They found that the most likely scenario is that black holes can exceed the Eddington limit for short periods, during which they grow very rapidly, followed by long periods of inactivity: the researchers say that black holes such as this one likely eat for five to ten million years, and sleep for about 100 million years.

“It sounds counterintuitive to explain a dormant black hole with periods of hyperactivity, but these short bursts allow it to grow quickly while spending most of its time napping,” said Maiolino.

Because the periods of dormancy are much longer than the periods of ultra-fast growth, it is in these periods that astronomers are most likely to detect black holes.

“This was the first result I had as part of my PhD, and it took me a little while to appreciate just how remarkable it was,” said Juodžbalis. “It wasn’t until I started speaking with my colleagues on the theoretical side of astronomy that I was able to see the true significance of this black hole.”

Due to their low luminosities, dormant black holes are more challenging for astronomers to detect, but the researchers say this black hole is almost certainly the tip of a much larger iceberg, if black holes in the early universe spend most of their time in a dormant state.

“It’s likely that the vast majority of black holes out there are in this dormant state – I’m surprised we found this one, but I’m excited to think that there are so many more we could find,” said Maiolino.

The observations were obtained as part of the JWST Advanced Deep Extragalactic Survey (JADES). The research was supported in part by the European Research Council and the Science and Technology Facilities Council (STFC), part of UK Research and Innovation (UKRI).


Bibliographic Information:

“A dormant, overmassive black hole in the early Universe”, by Ignas Juodžbalis, Roberto Maiolino, William M. Baker, Sandro Tacchella, Jan Scholtz, Francesco D’Eugenio, Raffaella Schneider, Alessandro Trinca, Rosa Valiante, Christa DeCoursey, Mirko Curti, Stefano Carniani, Jacopo Chevallard, Anna de Graaff, Santiago Arribas, Jake S. Bennett, Martin A. Bourne, Andrew J. Bunker, Stephane Charlot, Brian Jiang, Sophie Koudmani, Michele Perna, Brant Robertson, Debora Sijacki, Hannah Ubler, Christina C. Williams, Chris Willott, Joris Witstok, has been published on Nature (18-Dec-2024).

Press release from the University of Cambridge

Astronomers find surprising shapes in Jupiter’s upper atmosphere, above the Great Red Spot

Using the NASA/ESA/CSA James Webb Space Telescope, scientists observed the region above Jupiter’s iconic Great Red Spot to discover a variety of previously unseen features. The region, previously believed to be unremarkable in nature, hosts a variety of intricate structures and activity.

A image of a small area of Jupiter’s atmosphere, shaped like a jagged rectangle. The image is fuzzy and ranges from red to blue in colours, where bluer colours show lower altitudes in Jupiter’s atmosphere, and redder colours show higher altitudes. The image is centred on the Great Red Spot, which stands out as a blue circle.
New observations of the Great Red Spot on Jupiter have revealed that the planet’s atmosphere above and around the infamous storm is surprisingly interesting and active. This image shows the region observed by Webb’s Near-InfraRed Spectrograph (NIRSpec). It is stitched together from six NIRSpec Integral Field Unit images taken in July 2022, each around 300 square kilometres.
The NIRSpec observations show infrared light emitted by hydrogen molecules in Jupiter’s ionosphere. These molecules lie over 300 kilometres above the clouds of the storm, where light from the Sun ionises the hydrogen and stimulates this infrared emission. In this image, redder colours display the hydrogen emission from these high altitudes in the planet’s ionosphere. Bluer colours show infrared light from lower altitudes, including cloud-tops in the atmosphere and the very prominent Great Red Spot.
Jupiter is distant from the Sun and therefore receives a uniform, low level of daylight, meaning that most of the planet’s surface is relatively dim at these infrared wavelengths — especially compared to the emission from molecules near the poles, where Jupiter’s magnetic field is especially strong. Contrary to the researchers’ expectations that this area would therefore look homogeneous in nature, it hosts a variety of intricate structures, including dark arcs and bright spots, across the entire field of view.
Credit: Credit: ESA/Webb, NASA & CSA, H. Melin, M. Zamani (ESA/Webb)

Jupiter is one of the brightest objects in the night sky, and it is easily seen on a clear night. Aside from the bright northern and southern lights at the planet’s polar regions, the glow from Jupiter’s upper atmosphere is weak and is therefore challenging for ground-based telescopes to discern details in this region. However, Webb’s infrared sensitivity allows scientists to study Jupiter’s upper atmosphere above the infamous Great Red Spot with unprecedented detail.

The upper atmosphere of Jupiter is the interface between the planet’s magnetic field and the underlying atmosphere. Here, the bright and vibrant displays of northern and southern lights can be seen, which are fuelled by the volcanic material ejected from Jupiter’s moon Io. However, closer to the equator, the structure of the planet’s upper atmosphere is influenced by incoming sunlight. Because Jupiter receives only 4% of the sunlight that is received on Earth, astronomers predicted this region to be homogeneous in nature.

A graphic with two panels. The left side is an infrared image of the planet Jupiter, labelled “Webb/NIRCam”. The planet is shown in multiple colours, especially at the poles, and on the Great Red Spot, visible as a circular storm at the planet’s bottom-right. The Spot is surrounded by a jagged rectangle highlight. The right side shows a close-in image of that area in different colours, labelled “Webb/NIRSpec”. A coloured bar shows that bluer colours on this side show lower altitudes in Jupiter’s atmosphere, and redder colours show higher altitudes.
New observations of the Great Red Spot on Jupiter have revealed that the planet’s atmosphere above and around the infamous storm is surprisingly interesting and active. This graphic shows the region observed by Webb — first its location on a NIRCam image of the whole planet (left), and the region itself (right), imaged by Webb’s Near-InfraRed Spectrograph (NIRSpec).
The NIRSpec image is stitched together from six NIRSpec Integral Field Unit images taken in July 2022, each around 300 square kilometres, and shows infrared light emitted by hydrogen molecules in Jupiter’s ionosphere. These molecules lie over 300 kilometres above the clouds of the storm, where light from the Sun ionises the hydrogen and stimulates this infrared emission. In this image, redder colours display the hydrogen emission from these high altitudes in the planet’s ionosphere. Bluer colours show infrared light from lower altitudes, including cloud-tops in the atmosphere and the very prominent Great Red Spot.
Jupiter is distant from the Sun and therefore receives a uniform, low level of daylight, meaning that most of the planet’s surface is relatively dim at these infrared wavelengths — especially compared to the emission from molecules near the poles, where Jupiter’s magnetic field is especially strong. Contrary to the researchers’ expectations that this area would therefore look homogeneous in nature, it hosts a variety of intricate structures, including dark arcs and bright spots, across the entire field of view.
Credit: ESA/Webb, NASA & CSA, Jupiter ERS Team, J. Schmidt, H. Melin, M. Zamani (ESA/Webb)

The Great Red Spot of Jupiter was observed by Webb’s Near-InfraRed Spectrograph (NIRSpec) in July 2022, using the instrument’s Integral Field Unit capabilities. The team’s Early Release Science observations sought to investigate if this region was in fact dull, and the region above the iconic Great Red Spot was targeted for Webb’s observations. The team was surprised to discover that the upper atmosphere hosts a variety of intricate structures, including dark arcs and bright spots, across the entire field of view.

We thought this region, perhaps naively, would be really boring,” shared team leader Henrik Melin of the University of Leicester in the United Kingdom. “It is in fact just as interesting as the northern lights, if not more so. Jupiter never ceases to surprise.”

Although the light emitted from this region is driven by sunlight, the team suggests there must be another mechanism altering the shape and structure of the upper atmosphere.

“One way in which you can change this structure is by gravity waves – similar to waves crashing on a beach, creating ripples in the sand,” explained Melin. “These waves are generated deep in the turbulent lower atmosphere, all around the Great Red Spot, and they can travel up in altitude, changing the structure and emissions of the upper atmosphere.”

The team explains that these atmospheric waves can be observed on Earth on occasion, however they are much weaker than those observed on Jupiter by Webb. They also hope to conduct follow-up Webb observations of these intricate wave patterns in the future to investigate how the patterns move within the planet’s upper atmosphere and to develop our understanding of the energy budget of this region and how the features change over time.

These findings may also support ESA’s Jupiter Icy Moons Explorer, Juice, which was launched on 14 April 2023. Juice will make detailed observations of Jupiter and its three large ocean-bearing moons — Ganymede, Callisto and Europa — with a suite of remote sensing, geophysical and in situ instruments. The mission will characterise these moons as both planetary objects and possible habitats, explore Jupiter’s complex environment in depth, and study the wider Jupiter system as an archetype for gas giants across the Universe.

These observations were taken as part of the Early Release Science programme #1373ERS Observations of the Jovian System as a Demonstration of JWST’s Capabilities for Solar System Science (Co-PIs: I. de Pater, T. Fouchet).

“This ERS proposal was written back in 2017,” shared team member Imke de Pater of the University of California, Berkeley. “One of our objectives had been to investigate why the temperature above the Great Red Spot appeared to be high, as at the time recent observations with the NASA Infrared Telescope Facility had revealed. However, our new data showed very different results.”

These results have been published in Nature Astronomy.


Press release from ESA Webb

Webb unlocks secrets of GN-z11, one of the most distant galaxies ever seen

Looking deep into space and time, two teams using the NASA/ESA/CSA James Webb Space Telescope have studied the exceptionally luminous galaxy GN-z11, which existed when our 13.8 billion-year-old Universe was only about 430 million years old.

A rectangular image with thousands of galaxies of various shapes and colours on the black background of space. Some are noticeably spirals, either face-on or edge-on, while others are blobby ellipticals. Many are too small to discern any structure. One prominent foreground star at top centre features Webb’s signature eight-point diffraction spikes.
This image from Webb’s NIRCam (Near-Infrared Camera) instrument shows a portion of the GOODS-North field of galaxies.
Credit: NASA, ESA, CSA, B. Robertson (UC Santa Cruz), B. Johnson (CfA), S. Tacchella (Cambridge), M. Rieke (University of Arizona), D. Eisenstein (CfA)

Delivering on its promise to transform our understanding of the early Universe, the James Webb Space Telescope is probing galaxies near the dawn of time. One of these is the exceptionally luminous galaxy GN-z11, which existed when the Universe was just a tiny fraction of its current age. Initially detected with the NASA/ESA Hubble Space Telescope, it is one of the youngest and most distant galaxies ever observed, and it is also one of the most enigmatic. Why is it so bright? Webb appears to have found the answer.

A team studying GN-z11 with Webb found the first clear evidence that the galaxy is hosting a central, supermassive black hole that is rapidly accreting matter. Their finding makes this the most distant active supermassive black hole spotted to date.

“We found extremely dense gas that is common in the vicinity of supermassive black holes accreting gas,” explained principal investigator Roberto Maiolino of the Cavendish Laboratory and the Kavli Institute of Cosmology at the University of Cambridge in the United Kingdom. “These were the first clear signatures that GN-z11 is hosting a black hole that is gobbling matter.”

Using Webb, the team also found indications of ionised chemical elements typically observed near accreting supermassive black holes. Additionally, they discovered that the galaxy is expelling a very powerful wind. Such high-velocity winds are typically driven by processes associated with vigorously accreting supermassive black holes.

“Webb’s NIRCam (Near-Infrared Camera) has revealed an extended component, tracing the host galaxy, and a central, compact source whose colours are consistent with those of an accretion disc surrounding a black hole,” said investigator Hannah Übler, also of the Cavendish Laboratory and the Kavli Institute.

Together, this evidence shows that GN-z11 hosts a two-million-solar-mass, supermassive black hole in a very active phase of consuming matter, which is why it’s so luminous.

A second team, also led by Maiolino, used Webb’s NIRSpec (Near-Infrared Spectrograph) to find a gaseous clump of helium in the halo surrounding GN-z11.

“The fact that we don’t see anything else beyond helium suggests that this clump must be fairly pristine,” said Maiolino. “This is something that was expected by theory and simulations in the vicinity of particularly massive galaxies from these epochs — that there should be pockets of pristine gas surviving in the halo, and these may collapse and form Population III star clusters.”

A graphic labelled Galaxy GN-z11, Pristine Gas Clump Near GN-z11. The graphic is divided into two sections. The top half of the graphic features a rectangular image of a field of galaxies with two pullouts, the second of them labelled Helium Two Detected. The bottom half shows a single line graph.
This two-part graphic shows evidence of a gaseous clump of helium in the halo surrounding the galaxy GN-z11. In the top portion, at the far right, a small box identifies GN-z11 in a field of galaxies. The middle box shows a zoomed-in image of the galaxy. The box at the far left displays a map of the helium gas in the halo of GN-z11, including a clump that does not appear in the infrared colours shown in the middle panel. In the lower half of the graphic, a spectrum shows the distinct ‘fingerprint’ of helium in the halo. The full spectrum shows no evidence of other elements and so suggests that the helium clump must be fairly pristine, made almost entirely of hydrogen and helium gas left over from the Big Bang, without much contamination from heavier elements produced by stars. Theory and simulations in the vicinity of particularly massive galaxies from these epochs predict that there should be pockets of pristine gas surviving in the halo, and these may collapse and form Population III star clusters.
Credit: NASA, ESA, CSA, Ralf Crawford (STScI)

Finding the so far unseen Population III stars [1] — the first generation of stars formed almost entirely from hydrogen and helium — is one of the most important goals of modern astrophysics. These stars are expected to be very massive, very luminous, and very hot. Their signature would be the presence of ionised helium and the absence of chemical elements heavier than helium.

The formation of the first stars and galaxies marks a fundamental shift in cosmic history, during which the Universe evolved from a dark and relatively simple state into the highly structured and complex environment we see today.

In future Webb observations, Maiolino, Übler, and their team will explore GN-z11 in greater depth, and they hope to strengthen the case for the Population III stars that may be forming in its halo.

The research on the pristine gas clump in GN-z11’s halo has been accepted for publication in Astronomy & Astrophysics. The results of the study of GN-z11’s black hole were published in the journal Nature on 17 January 2024. The data was obtained as part of the JWST Advanced Deep Extragalactic Survey (JADES), a joint project between the NIRCam and NIRSpec teams.

A rectangular image with thousands of galaxies of various shapes and colours on the black background of space. Some are noticeably spirals, either face-on or edge-on, while others are blobby ellipticals. Many are too small to discern any structure. One prominent foreground star at top centre features Webb’s signature eight-point diffraction spikes. At lower right, a small region is highlighted with a white box. Vertical lines extend upward like a cone to the bottom corners of a larger box at upper right, showing a zoomed-in version of the highlighted area. The pullout features a galaxy labelled GN-z11, seen as a fuzzy yellow dot. Above it is another galaxy, seen as a fuzzy red oval.
This image from Webb’s NIRCam (Near-Infrared Camera) instrument shows a portion of the GOODS-North field of galaxies. At the lower right, a pullout highlights the galaxy GN-z11, which is seen at a time just 430 million years after the Big Bang. The image reveals an extended component, tracing the GN-z11 host galaxy, and a central, compact source whose colours are consistent with those of an accretion disc surrounding a black hole.
Credit: NASA, ESA, CSA, B. Robertson (UC Santa Cruz), B. Johnson (CfA), S. Tacchella (Cambridge), M. Rieke (University of Arizona), D. Eisenstein (CfA)

Notes

[1] The name Population III arose because astronomers had already classified the stars of the Milky Way as Population I (stars like the Sun, which are rich in heavier elements) and Population II (older stars with a low heavy-element content, found in the Milky Way bulge and halo, and in globular star clusters).

A rectangular image shows thousands of galaxies of various shapes and colours on the black background of space. The pullout features a galaxy labelled GN-z11, seen as a fuzzy yellow dot. Above it is another galaxy, seen as a fuzzy red oval. To the left of the small box, a scale bar is labelled 60 arcseconds. It extends about one tenth of the way across the image. Below the image, a list of NIRCam filters show what colours were used to make the image. Filters shown in blue are F090W, F115W, and F150W. Filters shown in green are F200W, F277W, and F335M. Filters shown in red are F356W, F410M, and F444W.
This image of the GOODS-North field, captured by Webb’s Near-Infrared Camera (NIRCam), shows compass arrows, a scale bar, and a colour key for reference.
The north and east compass arrows show the orientation of the image on the sky. Note that the relationship between north and east on the sky (as seen from below) is flipped relative to direction arrows on a map of the ground (as seen from above).
The scale bar is labelled in angular distance on the sky, where one arcsecond is one 3600th of a degree. The scale bar is 60 arcseconds long.
This image shows invisible near-infrared wavelengths of light that have been translated into visible-light colours. The colour key shows which NIRCam filters were used when collecting the light. The colour of each filter name is the visible light colour used to represent the infrared light that passes through that filter.
Credit: NASA, ESA, CSA, B. Robertson (UC Santa Cruz), B. Johnson (CfA), S. Tacchella (Cambridge), M. Rieke (University of Arizona), D. Eisenstein (CfA)

Press release from ESA Webb.

Webb finds dwarf galaxies reionised the Universe

Using the unprecedented capabilities of the NASA/ESA/CSA James Webb Space Telescope, an international team of scientists have obtained the first spectroscopic observations of the faintest galaxies during the first billion years of the Universe. These findings help answer a longstanding question for astronomers: what sources caused the reionisation of the Universe? These news results have effectively demonstrated that small dwarf galaxies are the likely producers of prodigious amounts of energetic radiation.

Researching the evolution of the early Universe is an important aspect of modern astronomy. Much remains to be understood about the time in the Universe’s early history known as the era of reionisation [1]. It was a period of darkness without any stars or galaxies, filled with a dense fog of hydrogen gas, until the first stars ionised the gas around them and light began to travel through. Astronomers have spent decades trying to identify the sources that emitted radiation powerful enough to gradually clear away this hydrogen fog that blanketed the early Universe.

The Ultradeep NIRSpec and NIRCam ObserVations before the Epoch of Reionization (UNCOVER) programme (#2561) consists of both imaging and spectroscopic observations of the lensing cluster Abell 2744. An international team of astronomers used gravitational lensing by this target, also known as Pandora’s Cluster, to investigate the sources of the Universe’s period of reionisation. Gravitational lensing [2] magnifies and distorts the appearance of distant galaxies, so they look very different from those in the foreground. The galaxy cluster ‘lens’ is so massive that it warps the fabric of space itself, so much so that light from distant galaxies that passes through the warped space also takes on a warped appearance. The magnification effect allowed the team to study very distant sources of light beyond Abell 2744, revealing eight extremely faint galaxies that would otherwise be undetectable, even to Webb.

The team found that these faint galaxies are immense producers of ionising radiation, at levels that are four times larger than what was previously assumed. This means that most of the photons that reionised the Universe likely came from these dwarf galaxies.

This discovery unveils the crucial role played by ultra-faint galaxies in the early Universe’s evolution,” said team member Iryna Chemerynska of the Institut d’Astrophysique de Paris in France. “They produce ionising photons that transform neutral hydrogen into ionised plasma during cosmic reionisation. It highlights the importance of understanding low-mass galaxies in shaping the Universe’s history.

“These cosmic powerhouses collectively emit more than enough energy to get the job done,” added team leader Hakim Atek, Institut d’Astrophysique de Paris, CNRS, Sorbonne Université, France, and lead author of the paper describing this result. “Despite their tiny size, these low-mass galaxies are prolific producers of energetic radiation, and their abundance during this period is so substantial that their collective influence can transform the entire state of the Universe.”

To arrive at this conclusion, the team first combined ultra-deep Webb imaging data with ancillary imaging of Abell 2744 from the NASA/ESA Hubble Space Telescope in order to select extremely faint galaxy candidates in the epoch of reionisation. This was followed by spectroscopy with Webb’s Near-InfraRed Spectrograph (NIRSpec). The instrument’s Multi-Shutter Assembly was used to obtain multi-object spectroscopy of these faint galaxies. This is the first time scientists have robustly measured the number density of these faint galaxies, and they have successfully confirmed that they are the most abundant population during the epoch of reionisation. This also marks the first time that the ionising power of these galaxies has been measured, enabling the astronomers to determine that they are producing sufficient energetic radiation to ionise the early Universe.

“The incredible sensitivity of NIRSpec combined with the gravitational amplification provided by Abell 2744 enabled us to identify and study these galaxies from the first billion years of the Universe in detail, despite their being over 100 times fainter than our own Milky Way,” continued Atek.

In an upcoming Webb observing programme, termed GLIMPSE, scientists will obtain the deepest observations ever on the sky. By targeting another galaxy cluster, named Abell S1063, even fainter galaxies during the epoch of reionisation will be identified in order to verify whether this population is representative of the large-scale distribution of galaxies. As these new results are based on observations obtained in one field, the team notes that the ionising properties of faint galaxies can appear differently if they reside in over-dense regions. Additional observations in an independent field will therefore provide further insights to help verify these conclusions. The GLIMPSE observations will also help astronomers probe the period known as Cosmic Dawn, when the Universe was only a few million years old, to develop our understanding of the emergence of the first galaxies.

These results have been published today in the journal Nature.

small galaxies reionised the Universe A crowded galaxy field on a black background, with one large star dominating the image just right of center. Three areas are concentrated with larger white hazy blobs on the left, lower right, and upper right above the single star. Scattered between these areas are many smaller sources of light; some also have a hazy white glow, while many other are red or orange.
Webb finds dwarf galaxies reionised the Universe. Astronomers estimate 50 000 sources of near-infrared light are represented in this image from the NASA/ESA/CSA James Webb Space Telescope. Their light has travelled through various distances to reach the telescope’s detectors, representing the vastness of space in a single image. A foreground star in our own galaxy, to the right of the image centre, displays Webb’s distinctive diffraction spikes. Bright white sources surrounded by a hazy glow are the galaxies of Pandora’s Cluster, a conglomeration of already-massive clusters of galaxies coming together to form a mega cluster. The concentration of mass is so great that the fabric of spacetime is warped by gravity, creating a natural, super-magnifying glass called a ‘gravitational lens’ that astronomers can use to see very distant sources of light beyond the cluster that would otherwise be undetectable, even to Webb.
These lensed sources appear red in the image, and often as elongated arcs distorted by the gravitational lens. Many of these are galaxies from the early Universe, with their contents magnified and stretched out for astronomers to study.
Credit: NASA, ESA, CSA, I. Labbe (Swinburne University of Technology), R. Bezanson (University of Pittsburgh), A. Pagan (STScI)

Notes

[1] Theory predicts that the first stars were 30 to 300 times as massive as our Sun and millions of times as bright, burning for only a few million years before exploding as supernovae. The energetic ultraviolet light from these first stars was capable of splitting hydrogen atoms back into electrons and protons (or ionising them). This era, from the end of the dark ages to when the Universe was around a billion years old, is known as the epoch of reionisation. This is the period when most of the neutral hydrogen was reionised by the increasing radiation from the first massive stars. Reionisation is an important phenomenon in our Universe’s history as it presents one of the few means by which we can (indirectly) study these earliest stars and galaxies.

[2] Gravitational lensing occurs when a massive celestial body — such as a galaxy cluster — causes a sufficient curvature of spacetime for the path of light around it to be visibly bent, as if by a lens. The body causing the light to curve is accordingly called a gravitational lens. According to Einstein’s general theory of relativity, time and space are fused together in a quantity known as spacetime. Within this theory, massive objects cause spacetime to curve, and gravity is simply the curvature of spacetime. As light travels through spacetime, the theory predicts that the path taken by the light will also be curved by an object’s mass. Gravitational lensing is a dramatic and observable example of Einstein’s theory in action. Extremely massive celestial bodies such as galaxy clusters cause spacetime to be significantly curved. In other words, they act as gravitational lenses. When light from a more distant light source passes by a gravitational lens, the path of the light is curved, and a distorted image of the distant object results.


Press release from ESA Webb.

Webb identifies tiniest free-floating brown dwarf in star cluster IC 348

The discovery helps answer the question: How small can you go when forming stars?

Brown dwarfs are sometimes called failed stars, since they form like stars through gravitational collapse, but never gain enough mass to ignite nuclear fusion. The smallest brown dwarfs can overlap in mass with giant planets. In a quest to find the smallest brown dwarf, astronomers using the NASA/ESA/CSA James Webb Space Telescope have found the new record-holder: an object weighing just three to four times the mass of Jupiter.

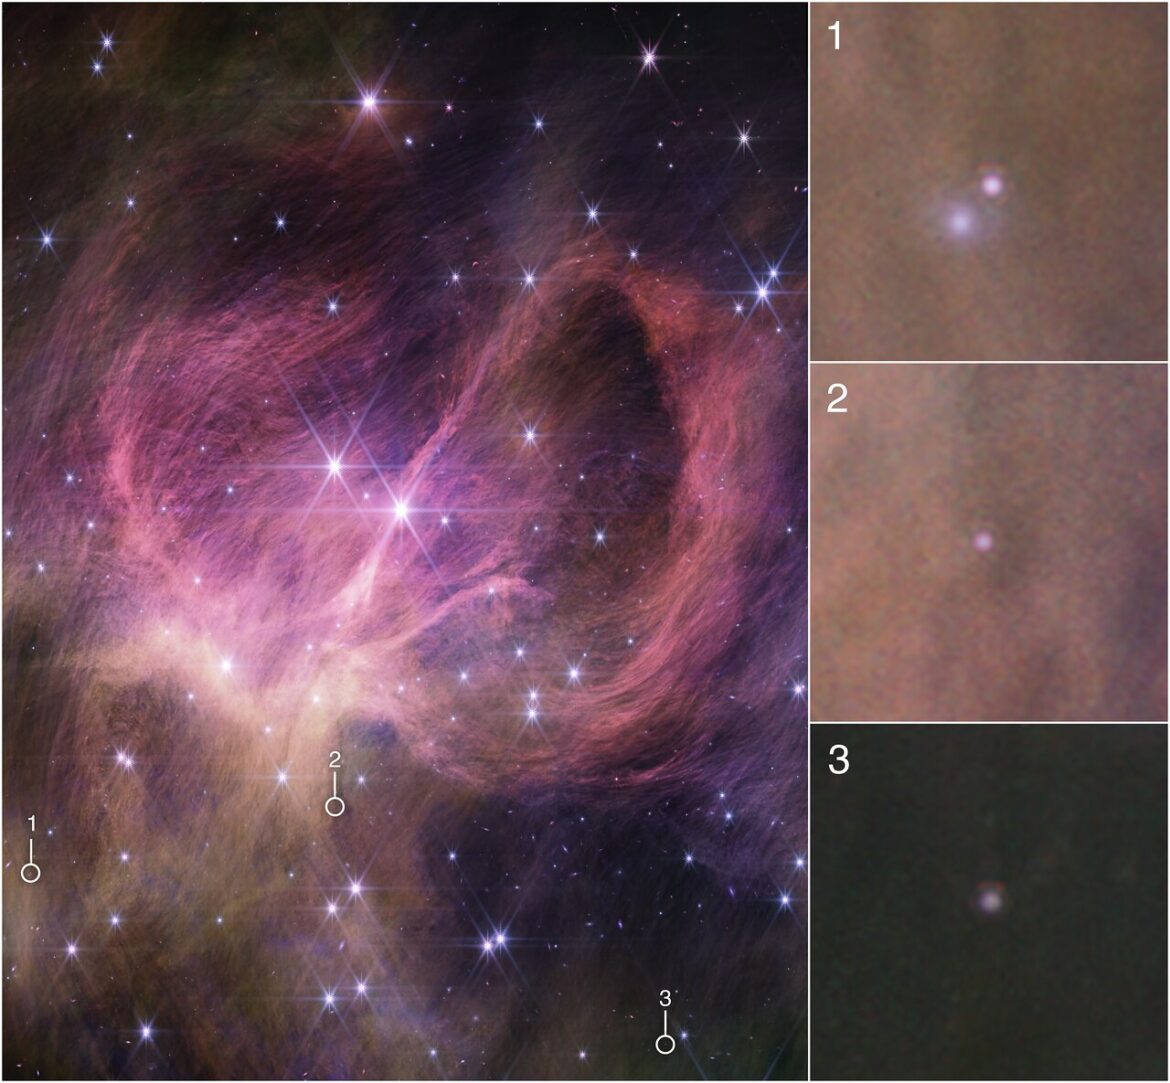
Image of a star cluster and nebula, with three image details pulled out in square boxes stacked vertically along the right. Main image is showing wispy pink-purple filaments and a scattering of stars. Each of the three boxes along the right corresponds to a small detail, numbered and circled, in the main image. Box 1 (top): A detail from the lower left of the main image shows a pair of small circular pinkish-white spots on a yellowish-brown background. Box 2 (middle): A detail from the middle of the lower part of the main image shows a single small circular pinkish spot on a yellowish-brown background. Box 3: A detail from the lower right edge of the main image shows a small circular pinkish spot on a dark brown background.
This image from the NIRCam (Near-Infrared Camera) instrument on NASA’s James Webb Space Telescope shows the central portion of the star cluster IC 348. Astronomers combed the cluster in search of tiny, free-floating brown dwarfs: objects too small to be stars but larger than most planets. They found three brown dwarfs that are less than eight times the mass of Jupiter, which are circled in the main image and shown in the detailed pullouts at right. The smallest weighs just three to four times as much as Jupiter, challenging theories for star formation.
The wispy curtains filling the image are interstellar material reflecting the light from the cluster’s stars — what is known as a reflection nebula. The material also includes carbon-containing molecules known as polycyclic aromatic hydrocarbons, or PAHs. The bright star closest to the centre of the frame is actually a pair of type B stars in a binary system, the most massive stars in the cluster. Winds from these stars may help sculpt the large loop seen on the right side of the field of view.
Credit: NASA, ESA, CSA, STScI, and K. Luhman (Penn State University) and C. Alves de Oliveira (European Space Agency)

Brown dwarfs are objects that straddle the dividing line between stars and planets. They form like stars, growing dense enough to collapse under their own gravity, but they never become dense and hot enough to begin fusing hydrogen and turn into a star. At the low end of the scale, some brown dwarfs are comparable with giant planets, weighing just a few times the mass of Jupiter.

Astronomers are trying to determine the smallest object that can form in a star-like manner. An international team using the NASA/ESA/CSA James Webb Space Telescope has identified the new record-holder: a tiny, free-floating brown dwarf with only three to four times the mass of Jupiter.

One basic question you’ll find in every astronomy textbook is, what are the smallest stars? That’s what we’re trying to answer,” explained lead author Kevin Luhman of Pennsylvania State University.

To locate this newfound brown dwarf, Luhman and his colleague, Catarina Alves de Oliveira, chose to study the star cluster IC 348, located about 1000 light-years away in the Perseus star-forming region. This cluster is young, only about five million years old. As a result, any brown dwarfs would still be relatively bright in infrared light, glowing from the heat of their formation.

The team first imaged the centre of the cluster using Webb’s NIRCam (Near-Infrared Camera) to identify brown dwarf candidates from their brightness and colours. They followed up on the most promising targets using Webb’s NIRSpec (Near-Infrared Spectrograph) microshutter array.

Webb’s infrared sensitivity was crucial, allowing the team to detect fainter objects than ground-based telescopes. In addition, Webb’s sharp vision enabled them to determine which red objects were pinpoint brown dwarfs and which were blobby background galaxies.

An image showing wispy pink-purple filaments and a scattering of stars. At the bottom left are compass arrows indicating the orientation of the image on the sky. The north arrow points in the 11 o’clock direction. The east arrow points toward 8 o’clock. Below the image is a colour key showing which filters were used to create the image and which visible-light colour is assigned to each infrared-light filter. From left to right, Webb NIRCam filters are F277W (blue), F360M (green), and F444W (red). A scale bar at the lower right of the image is about one-fifth the total width of the image, and text below it reads 0.1 light-years.
This image of star cluster IC 348, captured by Webb’s NIRCam (Near-Infrared Camera) instrument, shows compass arrows, a scale bar, and a colour key for reference.
The north and east compass arrows show the orientation of the image on the sky. Note that the relationship between north and east on the sky (as seen from below) is flipped relative to direction arrows on a map of the ground (as seen from above).
The scale bar is labelled in light-years, which is the distance that light travels in one Earth-year. (It takes 0.1 years for light to travel a distance equal to the length of the scale bar.) One light-year is equal to about 5.88 trillion miles or 9.46 trillion kilometres. The field of view shown in this image is approximately 0.5 light-years across and 0.8 light-years high.
This image shows invisible near-infrared wavelengths of light that have been translated into visible-light colours. The colour key shows which NIRCam filters were used when collecting the light. The colour of each filter name is the visible light colour used to represent the infrared light that passes through that filter.
Credit: NASA, ESA, CSA, STScI, and K. Luhman (Penn State University) and C. Alves de Oliveira (European Space Agency)

This winnowing process led to three intriguing targets weighing three to eight Jupiter masses, with surface temperatures ranging from 830 to 1500 degrees Celsius. The smallest of these weighs just three to four times Jupiter, according to computer models.

Explaining how such a small brown dwarf could form is theoretically challenging. A heavy and dense cloud of gas has plenty of gravity to collapse and form a star. However, because of its weaker gravity, it should be more difficult for a small cloud to collapse to form a brown dwarf, and that is especially true for brown dwarfs with the masses of giant planets.

It’s pretty easy for current models to make giant planets in a disc around a star,” said Catarina Alves de Oliveira of ESA, principal investigator on the observing program. “But in this cluster, it would be unlikely that this object formed in a disc, instead forming like a star, and three Jupiter masses is 300 times smaller than our Sun. So we have to ask, how does the star formation process operate at such very, very small masses?”

In addition to providing clues about the star formation process, tiny brown dwarfs also can help astronomers better understand exoplanets. The least massive brown dwarfs overlap with the largest exoplanets; therefore, they would be expected to have some similar properties. However, a free-floating brown dwarf is easier to study than a giant exoplanet since the latter is hidden within the glare of its host star.

Two of the brown dwarfs identified in this survey show the spectral signature of an unidentified hydrocarbon, a molecule containing both hydrogen and carbon atoms. The same infrared signature was detected by NASA’s Cassini mission in the atmospheres of Saturn and its moon Titan. It has also been seen in the interstellar medium, the gas between stars.

This is the first time we’ve detected this molecule in the atmosphere of an object outside our Solar System,” explained Alves de Oliveira. “Models for brown dwarf atmospheres don’t predict its existence. We’re looking at objects with younger ages and lower masses than we ever have before, and we’re seeing something new and unexpected.”

Since the objects are well within the mass range of giant planets, it raises the question of whether they are indeed brown dwarfs, or in fact rogue planets that were ejected from planetary systems. While the team can’t rule out the latter, they argue that they are far more likely to be brown dwarfs than an ejected planets.

An ejected giant planet is unlikely for two reasons. First, such planets are uncommon in general compared to planets with smaller masses. Second, most stars are low-mass stars, and giant planets are especially rare among those stars. As a result, it’s unlikely that most of the stars in IC 348 (which are low-mass stars) are capable of producing such massive planets. In addition, since the cluster is only five million years old, there probably hasn’t been enough time for giant planets to form and then be ejected from their systems.

The discovery of more such objects will help clarify their status. Theories suggest that rogue planets are more likely to be found in the outskirts of a star cluster, so expanding the search area may identify them if they exist within IC 348.

Future work may also include longer surveys that can detect fainter, smaller objects. The short survey conducted by the team was expected to detect objects as small as twice the mass of Jupiter. Longer surveys could easily reach one Jupiter mass.

These observations were taken as part of Guaranteed Time Observation program #1229. The results were published in the Astronomical Journal.

brown dwarf IC 348 Wispy hair-like filaments of pink-purple fill the middle of the image, curving left and right on either side of the centre. On the right, the filaments form a dramatic loop that seems to extend toward the viewer. At lower left are additional yellowish filaments. Two prominent, bright stars near the centre of the image show Webb’s eight-point diffraction spikes. Dozens of fainter stars are scattered across the image.
This image from the NIRCam (Near-Infrared Camera) instrument on the NASA/ESA/CSA James Webb Space Telescope shows the central portion of the star cluster IC 348. Astronomers combed the cluster in search of tiny, free-floating brown dwarfs: objects too small to be stars but larger than most planets. They found three brown dwarfs that are less than eight times the mass of Jupiter. The smallest weighs just three to four times as much as Jupiter, challenging theories for star formation.
The wispy curtains filling the image are interstellar material reflecting the light from the cluster’s stars — what is known as a reflection nebula. The material also includes carbon-containing molecules known as polycyclic aromatic hydrocarbons, or PAHs. The bright star closest to the centre of the frame is actually a pair of type B stars in a binary system, the most massive stars in the cluster. Winds from these stars may help sculpt the large loop seen on the right side of the field of view.
Credit: NASA, ESA, CSA, STScI, and K. Luhman (Penn State University) and C. Alves de Oliveira (European Space Agency)


Press release from ESA Webb.

JWST detected the neutron star merger (kilonova) that generated the explosion that created GRB 230307A and helped detecting the heavy element tellurium

Webb’s study of the second-brightest gamma-ray burst ever seen reveals tellurium.

Under what conditions many chemical elements are created in the universe has long been shrouded in mystery. This includes elements that are highly valuable, or even vital to life as we know it. Astronomers are now one step closer to an answer thanks to the James Webb Space Telescope and a high-energy event: the second-brightest gamma-ray burst ever detected, most likely caused by the merging of two neutron stars—which resulted in an explosion known as a kilonova. Using Webb’s spectacular sensitivity, scientists captured the first mid-infrared spectrum from space of a kilonova, which marked Webb’s first direct look at an individual heavy element from such an event.

Bright galaxies and other light sources in various sizes and shapes are scattered across a black swath of space: small points, hazy elliptical-like smudges with halos, and spiral-shaped blobs. The objects vary in colour: white, blue-white, yellow-white, and orange-red. Toward the centre right is a blue-white spiral galaxy seen face-on that is larger than the other light sources in the image. The galaxy is labelled “former home galaxy.” Toward the upper left is a small red point, which has a white circle around it and is labelled “GRB 230307A kilonova.
A team of scientists has used the NASA/ESA/CSA James Webb Space Telescope to observe an exceptionally bright gamma-ray burst, GRB 230307A, and its associated kilonova. Kilonovas—an explosion produced by a neutron star merging with either a black hole or with another neutron star—are extremely rare, making it difficult to observe these events. The highly sensitive infrared capabilities of Webb helped scientists identify the home address of the two neutron stars that created the kilonova.
This image from Webb’s NIRCam (Near-Infrared Camera) instrument highlights GRB 230307A’s kilonova and its former home galaxy among their local environment of other galaxies and foreground stars. The neutron stars were kicked out of their home galaxy and travelled the distance of about 120,000 light-years, approximately the diameter of the Milky Way galaxy, before finally merging several hundred million years later.
This image is a composite of separate exposures acquired by the James Webb Space Telescope using the NIRCam instrument. Several filters were used to sample wide wavelength ranges. The colour results from assigning different hues (colours) to each monochromatic (grayscale) image associated with an individual filter. In this case, the assigned colours are: Blue: F115W + F150W Green: F277W Red: F356W + F444W
Credit: NASA, ESA, CSA, STScI, A. Levan (IMAPP, Warw), A. Pagan (STScI)

A team of scientists has used multiple space- and ground-based telescopes, including the NASA/ESA/CSA James Webb Space Telescope, to observe an exceptionally bright gamma-ray burst, GRB 230307A, and identify the neutron star merger that generated the explosion that created the burst. Webb also helped scientists detect the chemical element tellurium in the aftermath of the explosion.

Other elements near tellurium on the periodic table — like iodine, which is needed for much of life on Earth — are also likely to be present among the kilonova’s ejected material. A kilonova is an explosion produced by a neutron star merging with either a black hole or with another neutron star.

Just over 150 years since Dmitri Mendeleev wrote down the periodic table of elements, we are now finally in a position to start filling in those last blanks of understanding where everything was made, thanks to Webb,”

said Andrew Levan of Radboud University in the Netherlands and the University of Warwick in the United Kingdom, lead author of the study.

While neutron star mergers have long been theorised as being the ideal “pressure cookers” to create some of the rarer elements substantially heavier than iron, astronomers have previously encountered a few obstacles to obtaining solid evidence.

The spectrum is plotted as a line graph of brightness versus wavelength of light (microns). The spectral lines range in wavelength of light along the x-axis, with the first tic labelled as “1.0” and the last tic labelled as “5.0,” and in brightness, with the level of brightness becoming greater moving higher along the y-axis. The Webb spectral line is white and jagged. About a third of the way across the graph, there is a distinct peak between 2.0 and 2.5 microns. After 2.5 microns, the spectral line slopes gradually up to the right. The model spectral line is red and smoother than the Webb data. The model’s spectral line at 1.0 micron begins low (dim) and flat before peaking between 2.0 and 2.5 microns, similar to the Webb data. The area below the model spectral line is shaded red and labelled “Tellurium T E.” The model spectral line then descends after 2.5 microns and follows the general trend of the Webb data.
This graphic presentation compares the spectral data of GRB 230307A’s kilonova as observed by the James Webb Space Telescope and a kilonova model. Both show a distinct peak in the region of the spectrum associated with tellurium, with the area shaded in red. The detection of tellurium, which is rarer than platinum on Earth, marks Webb’s first direct look at an individual heavy element from a kilonova.
Though astronomers have theorised neutron star mergers to be the ideal environment to create chemical elements, including some that are essential to life, these explosive events—known as kilonovas—are rare and rapid. Webb’s NIRSpec (Near-Infrared Spectrograph) acquired a spectrum of GRB 230307A’s kilonova, helping scientists secure evidence of the synthesis of heavy elements from neutron star mergers.
With Webb’s extraordinary ability to look further into space than ever before, astronomers expect to find even more kilonovas and acquire further evidence of heavy element creation.
Credit: NASA, ESA, CSA, J. Olmsted (STScI)

Kilonovas are extremely rare, making it difficult to observe these events. Short gamma-ray bursts (GRBs), traditionally thought to be those that last less than two seconds, can be byproducts of these infrequent merger episodes. In contrast, long gamma-ray bursts may last several minutes and are usually associated with the explosive death of a massive star.

The case of GRB 230307A is particularly remarkable. First detected by NASA’s Fermi Gamma-ray Space Telescope in March, it is the second brightest GRB observed in over 50 years of observations, about 1000 times brighter than a typical gamma-ray burst that Fermi observes. It also lasted for 200 seconds, placing it firmly in the category of long-duration gamma-ray bursts, despite its different origin.

This burst is way into the long category. It’s not near the border. But it seems to be coming from a merging neutron star,

added Eric Burns, a co-author of the paper and member of the Fermi team at Louisiana State University.

The collaboration of many telescopes on the ground and in space allowed scientists to piece together a wealth of information about this event as soon as the burst was detected. It is an example of how satellites and telescopes work together to witness changes in the Universe as they unfold.

After the initial detection, an intensive series of observations from the ground and from space, swung into action to pinpoint the source on the sky and track how its brightness changed. These observations in the gamma-ray, X-ray, optical, infrared, and radio showed that the optical/infrared counterpart was faint, evolved quickly, and became very red – the hallmarks of a kilonova.

This type of explosion is very rapid, with the material in the explosion also expanding swiftly,” said Om Sharan Salafia, a co-author of the study at the INAF – Brera Astronomical Observatory in Italy. “As the whole cloud expands, the material cools off quickly and the peak of its light becomes visible in the infrared, and becomes redder on timescales of days to weeks.”

At later times it would have been impossible to study this kilonova from the ground, but these were the perfect conditions for Webb’s NIRCam (Near-Infrared Camera) and NIRSpec (Near-Infrared Spectrograph) instruments to observe this tumultuous environment. The spectrum has broad lines that show the material is ejected at high speeds, but one feature is clear: light emitted by tellurium, an element rarer than platinum on Earth.

The highly sensitive infrared capabilities of Webb helped scientists identify the home address of the two neutron stars that created the kilonova: a spiral galaxy about 120,000 light-years away from the site of the merger.

Prior to their venture, they were once two normal massive stars that formed a binary system in their home spiral galaxy. Since the duo was gravitationally bound, both stars were launched together on two separate occasions: when one among the pair exploded as a supernova and became a neutron star, and when the other star followed suit.

Bright galaxies and other light sources in various sizes and shapes are scattered across a black swath of space: small points, hazy elliptical-like smudges with halos, and spiral-shaped blobs. The objects vary in colour: white, blue-white, yellow-white, and orange-red. Toward the centre right is a blue-white spiral galaxy seen face-on that is larger than the other light sources in the image. The galaxy is labelled “former home galaxy.” Toward the upper left is a small red point, which has a white circle around it and is labelled “GRB 230307A kilonova.”
A team of scientists has used the NASA/ESA/CSA James Webb Space Telescope to observe an exceptionally bright gamma-ray burst, GRB 230307A, and its associated kilonova. Kilonovas—an explosion produced by a neutron star merging with either a black hole or with another neutron star—are extremely rare, making it difficult to observe these events. The highly sensitive infrared capabilities of Webb helped scientists identify the home address of the two neutron stars that created the kilonova.
This image from Webb’s NIRCam (Near-Infrared Camera) instrument highlights GRB 230307A’s kilonova and its former home galaxy among their local environment of other galaxies and foreground stars. The neutron stars were kicked out of their home galaxy and travelled the distance of about 120,000 light-years, approximately the diameter of the Milky Way galaxy, before finally merging several hundred million years later.
This image is a composite of separate exposures acquired by the James Webb Space Telescope using the NIRCam instrument. Several filters were used to sample wide wavelength ranges. The colour results from assigning different hues (colours) to each monochromatic (grayscale) image associated with an individual filter. In this case, the assigned colours are: Blue: F115W + F150W Green: F277W Red: F356W + F444W
Credit: NASA, ESA, CSA, STScI, A. Levan (IMAPP, Warw), A. Pagan (STScI)

In this case, the neutron stars remained as a binary system despite two explosive jolts and were kicked out of their home galaxy. The pair travelled approximately the equivalent of the Milky Way galaxy’s diameter before merging several hundred million years later.

Scientists expect to find even more kilonovas in the future thanks to the increasing number of opportunities to have space and ground-based telescopes working in complementary ways to study changes in the Universe.

Webb provides a phenomenal boost and may find even heavier elements,” said Ben Gompertz, a co-author of the study at the University of Birmingham in the United Kingdom. “As we get more frequent observations, the models will improve and the spectrum may evolve more in time. Webb has certainly opened the door to do a lot more, and its abilities will be completely transformative for our understanding of the Universe.”

These findings have been published in the journal Nature.

heavy element kilonova Bright galaxies and other light sources in various sizes and shapes are scattered across a black swath of space: small points, hazy elliptical-like smudges with halos, and spiral-shaped blobs. The objects vary in colour: white, blue-white, yellow-white, and orange-red. Toward the centre right is a blue-white spiral galaxy seen face-on that is larger than the other light sources in the image.
A team of scientists has used the NASA/ESA/CSA James Webb Space Telescope to observe an exceptionally bright gamma-ray burst, GRB 230307A, and its associated kilonova. Kilonovas—an explosion produced by a neutron star merging with either a black hole or with another neutron star—are extremely rare, making it difficult to observe these events. The highly sensitive infrared capabilities of Webb helped scientists identify the home address of the two neutron stars that created the kilonova.
This image from Webb’s NIRCam (Near-Infrared Camera) instrument highlights GRB 230307A’s kilonova and its former home galaxy among their local environment of other galaxies and foreground stars. The neutron stars were kicked out of their home galaxy and travelled the distance of about 120,000 light-years, approximately the diameter of the Milky Way galaxy, before finally merging several hundred million years later.
This image is a composite of separate exposures acquired by the James Webb Space Telescope using the NIRCam instrument. Several filters were used to sample wide wavelength ranges. The colour results from assigning different hues (colours) to each monochromatic (grayscale) image associated with an individual filter. In this case, the assigned colours are: Blue: F115W + F150W Green: F277W Red: F356W + F444W
Credit: NASA, ESA, CSA, STScI, A. Levan (IMAPP, Warw), A. Pagan (STScI)

Press release from ESA Webb