Ad
Ad
Ad
Tag

MIRI

Browsing

Webb studies moon-forming disc around massive planet CT Cha B

The disc offers insight into how the moons of solar system gas giants like Jupiter might have formed.

The NASA/ESA/CSA James Webb Space Telescope has provided the first direct measurements of the chemical and physical properties of a potential moon-forming disc encircling a large exoplanet. The carbon-rich disc surrounding the world called CT Cha B, which is located 625 light years away from Earth, is a possible construction yard for moons, although no moons are detected in the Webb data.

Our Solar System contains eight major planets, and more than 400 known moons orbiting six of these planets. Where did they all come from? There are multiple formation mechanisms. The case for large moons, like the four Galilean satellites around Jupiter, is that they condensed out of a dust and gas disc encircling the planet when it formed. But that would have happened over 4 billion years ago, and there is scant forensic evidence today.

Webb has now provided the first direct view of material in a disc around a large exoplanet. An international team of astronomers have uncovered a carbon-rich disc encircling the world called CT Cha b, which is located 625 light-years away from Earth.

The young star the planet orbits is only 2 million years old and still accreting circumstellar material. However, the circumplanetary disc discovered by Webb is not part of the larger accretion disc around the central star. The two objects are 74 billion kilometres apart.

Observing planet and moon formation is fundamental to understanding the evolution of planetary systems across our galaxy. Moons likely outnumber planets, and some might be habitats for life as we know it. But we are now only entering an era where we can witness their formation.

This discovery fosters a better understanding of planet and moon formation, say researchers. Webb’s data is invaluable for making comparisons to our Solar System’s birth over 4 billion years ago.

“We can see evidence of the disc around the companion, and we can study the chemistry for the first time. We’re not just witnessing moon formation – we’re also witnessing this planet’s formation,” said co-lead author Sierra Grant of the Carnegie Institution for Science in Washington, D.C., USA.

“We are seeing what material is accreting to build the planet and moons,” added main lead author Gabriele Cugno of the University of Zurich in Switzerland and member of the National Centre of Competence in Research PlanetS.

Dissecting starlight

Infrared observations of CT Cha b were made with Webb’s MIRI (Mid-Infrared Instrument) using its medium resolution spectrograph. An initial look into Webb’s archival data revealed signs of molecules within the circumplanetary disc, which motivated a deeper dive into the data. Because the planet’s faint signal is buried in the glare of the host star, the researchers had to disentangle the light of the star from the planet using high-contrast methods.

“We saw molecules at the location of the planet, and so we knew that there was stuff in there worth digging for and spending a year trying to tease out of the data. It really took a lot of perseverance,” said Grant.

Ultimately, the team discovered seven carbon-bearing molecules within the planet’s disc, including acetylene (C2H2) and benzene (C6H6). This carbon-rich chemistry is in stark contrast to the chemistry seen in the disc around the host star, where the researchers found water but no carbon. The difference between the two discs offers evidence for their rapid chemical evolution over only 2 million years.

Genesis of moons

A circumplanetary disc of debris has long been hypothesized as the birthplace of Jupiter’s four major moons. These Galilean satellites must have condensed out of such a flattened disc billions of years ago, as evident in their co-planar orbits about Jupiter. The two outermost Galilean moons, Ganymede and Callisto, are 50% water ice. But they presumably have rocky cores, perhaps made of carbon or silicon.

“We want to learn more about how our Solar System formed moons. This means that we need to look at other systems that are still under construction. We’re trying to understand how it all works,” said Cugno. “How do these moons come to be? What are the ingredients? What physical processes are at play, and over what timescales? Webb allows us to witness the drama of moon formation and investigate these questions observationally for the first time.”

In the coming year, the team will use Webb to perform a comprehensive survey of similar objects to better understand the diversity of physical and chemical properties in the discs around young planets.

This is an illustration of a young planet with a surrounding disc of dust and gas, potentially forming moons. The planet, which appears red, is shown at lower right, enveloped by a cloudy disc. The host star appears at upper left, and glows yellow, with its own reddish disc of debris. The black background of space is speckled with stars. At the bottom of the illustration, graphics of molecules are listed in the following order: Acetylene, Carbon Dioxide, Ethane, Benzene, Hydrogen cyanide.
The James Webb Space Telescope studies the potential moon-forming disc around the massive exoplanet CT Cha B. An artistic rendering of a dust and gas disc encircling the young exoplanet, CT Cha b, 625 light-years from Earth. Spectroscopic data from the NASA/ESA/CSA James Webb Space Telescope suggest the disc contains the raw materials for moon formation. The planet appears at lower right, while its host star and surrounding protoplanetary disc are visible in the background.
Credit: NASA, ESA, CSA, STScI, G. Cugno (University of Zürich, NCCR PlanetS), S. Grant (Carnegie Institution for Science), J, Olmsted (STScI), L. Hustak (STScI)

Bibliographic information:

Gabriele Cugno and Sierra L. Grant 2025, ApJL 991 L46, DOI: 10.3847/2041-8213/ae0290


Press release from ESA Webb.

Webb explores Sagittarius B2, the largest star-forming cloud in the Milky Way

The NASA/ESA/CSA James Webb Space Telescope has revealed a colourful array of massive stars and glowing cosmic dust in the Sagittarius B2 (Sgr B2) molecular cloud, the most massive and active star-forming region in our Milky Way galaxy.

A wide view of a region of space filled with stars and clumps of orange clouds.
Stars, gas and cosmic dust in the Sagittarius B2 molecular cloud glow in near-infrared light, captured by Webb’s NIRCam (Near-Infrared Camera). In this light, astronomers see more of the region’s diverse, colourful stars, but less of its gas and dust structure. Webb’s instruments each provide astronomers with important information that help build a more complete picture of what is happening in this intriguing portion of the centre of our galaxy.
Credit: NASA, ESA, CSA, STScI, A. Ginsburg (University of Florida), N. Budaiev (University of Florida), T. Yoo (University of Florida). Image processing: A. Pagan (STScI)

Sagittarius B2 is the Milky Way galaxy’s most massive and active star forming cloud, producing half of the stars created in the galactic centre region despite having only 10 percent of the area’s star-making material. Now, Webb has revealed stunning new views of the region, using both its near-infrared and mid-infrared instruments, to capture both its colourful stars and gaseous stellar nurseries in unprecedented detail.

Sagittarius B2 is located only a few hundred light-years from the supermassive black hole at the heart of the galaxy called Sagittarius A*, a region densely packed with stars, star-forming clouds, and complex magnetic fields. The infrared light that Webb detects is able to pass through some of the area’s thick clouds to reveal young stars and the warm dust surrounding them. Astronomers think that analysis of Webb’s data will help unravel enduring mysteries of the star formation process, and why Sagittarius B2 is forming so many more stars than the rest of the galactic centre.

However, one of the most notable aspects of Webb’s images of Sagittarius B2 are the portions that remain dark. These ironically empty-looking areas of space are actually so dense with gas and dust that even Webb cannot see through them. These thick clouds are the raw material of future stars and a cocoon for those still too young to shine.

Cosmic clouds of pink and purple, some with bright centres, are surrounded by dark areas that appear like black space dotted with bright blue stars. A group of small clouds to the right is more red than any other area of the image.
Webb’s MIRI (Mid-Infrared Instrument) shows the Sagittarius B2 (Sgr B2) region in mid-infrared light, with warm dust glowing brightly. To the right is one clump of clouds that captured astronomers’ attention. It is redder than the rest of the clouds in the image and corresponds to an area that other telescopes have shown to be one of the most molecularly rich regions known. Additional analysis of this intriguing region could yield important insights into why Sgr B2 is so much more productive in making stars than the rest of the galactic centre. Only the brightest stars in this region emit mid-infrared light that can be picked up by Webb’s MIRI instrument, which is why this image has so many fewer stars than that captured by Webb’s NIRCam (Near-Infrared Camera). The darkest areas of the image are not empty space but areas where cosmic dust and gas are so dense that light cannot penetrate them to reach the telescope.
Credit: NASA, ESA, CSA, STScI, A. Ginsburg (University of Florida), N. Budaiev (University of Florida), T. Yoo (University of Florida). Image processing: A. Pagan (STScI)

The high resolution and mid-infrared sensitivity of Webb’s MIRI (Mid-Infrared Instrument) revealed this region in unprecedented detail, including glowing cosmic dust heated by very young massive stars. The reddest area, known as Sagittarius B2 North, (note: north is to the right in these Webb images) is one of the most molecularly rich regions known, but astronomers have never seen it with such clarity.

Sagittarius B2 (Sgr B2) molecular cloud Cosmic clouds of pink and purple, some with bright centres, are surrounded by dark areas that appear like black space dotted with bright blue stars. A small cloud to the lower right is more red than any other area of the image. At the top right are compass arrows indicating the orientation of the image on the sky. The north arrow points to just past 3 o’clock, and the east arrow points to just past 12 o’clock. At the lower right is a scale bar labeled 5 light-years. The length of the scale bar is about 7 times the total width of the image. Below the image is a colour key showing which filters were used to create the image and which visible-light colour is assigned to each filter. From left to right, the filters are: F770W in blue, F1280W in green, and F2550W is red.
This image of the Sagittarius B2 (Sgr B2) molecular cloud, captured by Webb’s MIRI (Mid-Infrared Instrument) includes compass arrows, scale bar, and colour key for reference. To create this image, mid-infrared wavelengths of light have been translated into visible-light colours. The colour key at the bottom shows which MIRI filters were used, and which visible-light colour was assigned to that filter. The north and east compass arrows show the orientation of the image on the sky. Note that the relationship between north and east on the sky (as seen from below) is flipped relative to direction arrows on a map of the ground (as seen from above).
Credit: NASA, ESA, CSA, STScI, A. Ginsburg (University of Florida), N. Budaiev (University of Florida), T. Yoo (University of Florida). Image processing: A. Pagan (STScI)

The difference longer wavelengths of light make, even within the infrared spectrum, are stark when comparing the images from Webb’s MIRI and NIRCam (Near-Infrared Camera) instruments. Glowing gas and dust appear dramatically in mid-infrared light, while all but the brightest stars disappear from view.

In contrast to MIRI, colourful stars steal the show in Webb’s NIRCam image, punctuated occasionally by bright clouds of gas and dust. Further research into these stars will reveal details of their masses and ages, which will help astronomers better understand the process of star formation in this dense, active galactic centre region. Has it been going on for millions of years? Or has some unknown process triggered it only recently?

Sagittarius B2 (Sgr B2) molecular cloud A region of space filled with stars and clumps of orange clouds. At the top right are compass arrows indicating the orientation of the image on the sky. The north arrow points to 3 o’clock, and the east arrow points to 12 o’clock. At the lower right is a scale bar labeled 10 light-years. The length of the scale bar is about 5 times the total width of the image. Below the image is a colour key showing which filters were used to create the image and which visible-light colour is assigned to each filter. From left to right, the filters are: F150W, F182M, and F187N are blue; F212N and F210M are cyan; F300M and F360M are green; F405N is yellow; F410M is light orange; F466N and F480M are orange.
This image of the Sagittarius B2 (Sgr B2) molecular cloud, captured by Webb’s NIRCam (Near-Infrared Camera) instrument includes compass arrows, scale bar, and colour key for reference. To create this image, near-infrared wavelengths of light have been translated into visible-light colours. The colour key at the bottom shows which NIRCam filters were used, and which visible-light colour was assigned to that filter. The north and east compass arrows show the orientation of the image on the sky. Note that the relationship between north and east on the sky (as seen from below) is flipped relative to direction arrows on a map of the ground (as seen from above).
Credit: NASA, ESA, CSA, STScI, A. Ginsburg (University of Florida), N. Budaiev (University of Florida), T. Yoo (University of Florida). Image processing: A. Pagan (STScI)

Astronomers hope Webb will shed light on why star formation in the galactic centre is so disproportionate. Though the region is stocked with plenty of gaseous raw material, on the whole it is not nearly as productive as Sagittarius B2. While Sagittarius B2 has only 10 percent of the galactic centre’s gas, it produces 50 percent of its stars.

Bibliographic information:

Nazar Budaiev, Adam Ginsburg, Ashley T. Barnes, Desmond Jeff, Taehwa Yoo, Cara Battersby, Alyssa Bulatek, Xing Lu, Elisabeth A.C. Mills, Daniel L. Walker, JWST’s first view of the most vigorously star-forming cloud in the Galactic center — Sagittarius B2, DOI: https://doi.org/10.48550/arXiv.2509.11771

Press release from ESA Webb.

Webb finds new evidence for planet, a gas giant orbiting Alpha Centauri A, our closest solar twin

Astronomers using the NASA/ESA/CSA James Webb Space Telescope have found strong evidence of a giant planet orbiting a star in the stellar system closest to our own Sun. At just 4 light-years away from Earth, the Alpha Centauri triple star system has long been a compelling target in the search for worlds beyond our solar system.

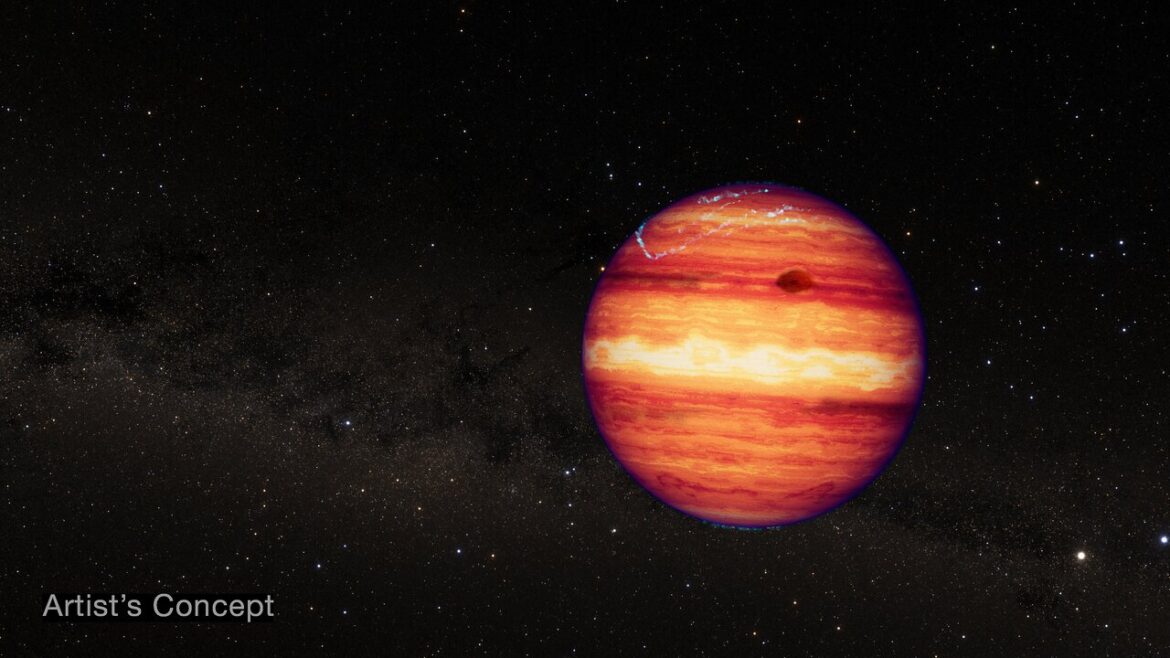
Illustration of a large spherical object that looks like a gas giant planet. The object appears to have bands of tan, orange, and dark red horizontal lines forming patterns similar to those in the atmosphere of Jupiter. The background is filled with thousands of distant stars that form a Milky Way-like band running from left to right. The host star, Alpha Centauri A, appears as a glowing white circle to the upper left of the planet. Further off in the distance above and to the right of the planet is a smaller glowing circle, nearby Alpha Centauri B. The words “Artist’s Concept” are in the lower left corner.
This artist’s concept shows what the gas giant orbiting Alpha Centauri A could look like. Observations of the triple star system Alpha Centauri using the NASA/ESA/CSA James Webb Space Telescope indicate the potential gas giant, about the mass of Saturn, orbiting the star by about two times the distance between the Sun and Earth.
In this concept, Alpha Centauri A is depicted at the upper left of the planet, while the other Sun-like star in the system, Alpha Centauri B, is at the upper right. Our Sun is shown as a small dot of light between those two stars.
Credit: NASA, ESA, CSA, STScI, R. Hurt (Caltech/IPAC)

Visible only from Earth’s Southern hemisphere, it’s made up of the binary Alpha Centauri A and Alpha Centauri B, both Sun-like stars, and the faint red dwarf star Proxima Centauri. Alpha Centauri A is the third brightest star in the night sky. While there are three confirmed planets orbiting Proxima Centauri, the presence of other worlds surrounding Alpha Centauri A and Alpha Centauri B has proved challenging to confirm.

Now, Webb’s observations from its Mid-Infrared Instrument (MIRI) are providing the strongest evidence to date of a gas giant orbiting Alpha Centauri A. The results have been accepted in a series of two papers in The Astrophysical Journal Letters.

Three panels, each showing a different view of the binary star system Alpha Centauri. The panel on the left is a Digitized Sky Survey image showing a single bright blue point source at the center of a black image with small stars scattered throughout. The very center of this bright source is outlined with a vertical box, tilted slightly to the left, with two diagonal lines leading to the second panel. The second panel is a Hubble Space Telescope image that shows two white stars with 4 diffraction spikes each against a black background. The top star is labeled Alpha Cen B and the bottom Alpha Cen A. Alpha Cen A is outlined with a white square with two diagonal lines leading to the third panel at the furthest right, which shows a James Webb Space Telescope image of the star. An orange star icon and central black circle outlined in white marks the location of Alpha Cen A. A large white circle outlines a blurry red-toned field that surrounds the location of the star. A bright orange blob at 9 o’clock in relation to the star is labeled “S1” and circled
This image shows the Alpha Centauri star system from several different ground- and space-based observatories: the Digitized Sky Survey (DSS), the NASA/ESA Hubble Space Telescope, and the NASA/ESA/CSA James Webb Space Telescope. Alpha Centauri A is the third brightest star in the night sky, and the closest Sun-like star to Earth.
The ground-based image from DSS shows the triple system as a single source of light, while Hubble resolves the two Sun-like stars in the system, Alpha Centauri A and Alpha Centauri B.
The image from Webb’s MIRI (Mid-Infrared Instrument), which uses a coronagraphic mask to block the bright glare from Alpha Centauri A, reveals a potential planet orbiting the star.
Credit: NASA, ESA, CSA, STScI, DSS, A. Sanghi (Caltech), C. Beichman (JPL), D. Mawet (Caltech), J. DePasquale (STScI)

If confirmed, the planet would be the closest to Earth that orbits in the habitable zone of a Sun-like star. However, because the planet candidate is a gas giant, scientists say it would not support life as we know it.

“With this system being so close to us, any exoplanets found would offer our best opportunity to collect data on planetary systems other than our own. Yet, these are incredibly challenging observations to make, even with the world’s most powerful space telescope, because these stars are so bright, close, and move across the sky quickly,” said Charles Beichman, NASA’s Jet Propulsion Laboratory and the NASA Exoplanet Science Institute at Caltech’s IPAC astronomy center, co-first author on the new papers. “Webb was designed and optimized to find the most distant galaxies in the universe. The operations team at the Space Telescope Science Institute had to come up with a custom observing sequence just for this target, and their extra effort paid off spectacularly.”

Several rounds of meticulously planned observations by Webb, careful analysis by the research team, and extensive computer modeling helped determine that the source seen in Webb’s image is likely to be a planet, and not a background object (like a galaxy), foreground object (a passing asteroid), or other detector or image artifact.

The first observations of the system took place in August 2024, using the coronagraphic mask aboard MIRI to block Alpha Centauri A’s light. While extra brightness from the nearby companion star Alpha Centauri B complicated the analysis, the team was able to subtract out the light from both stars to reveal an object over 10,000 times fainter than Alpha Centauri A, separated from the star by about two times the distance between the Sun and Earth.

While the initial detection was exciting, the research team needed more data to come to a firm conclusion. However, additional observations of the system in February 2025 and April 2025 (using Director’s Discretionary Time) did not reveal any objects like the one identified in August 2024.

“We are faced with the case of a disappearing planet! To investigate this mystery, we used computer models to simulate millions of potential orbits, incorporating the knowledge gained when we saw the planet, as well as when we did not,” said PhD student Aniket Sanghi of the California Institute of Technology in Pasadena, California. Sanghi is a co-first author on the two papers covering the team’s research.

In these simulations, the team took into account both the 2019 sighting of a potential exoplanet candidate by the European Southern Observatory’s Very Large Telescope, the new data from Webb, and considered orbits that would be gravitationally stable in the presence of Alpha Centauri B, meaning the planet wouldn’t get flung out of the system.

Three panels, each showing a different view of the binary star system Alpha Centauri from the Webb. The left panel shows a rectangular image tilted at a 45 degree angle outlined in white on a grey background. The image is a blown-out bright source at the center, with 8, double columned reddish white diffraction spikes. The center of this bright source is outlined with a vertical box, tilted slightly to the left, with two diagonal lines leading to the second panel. This shows a view of both Alpha Centauri A at the bottom and Alpha Centauri B at the top, both with orange star icons over each star. The star icons are surrounded by mottled red and white blotches. The bottom star is outlined with a white square with two diagonal lines leading to the third panel. Within a large white circle there is a blurry red-toned field with an orange star icon and central black circle outlined in white marking the location of Alpha Cen A. A bright orange blob at 9 o’clock in relation to the star is labeled “S1” and circled.
This 3-panel image captures the NASA/ESA/CSA James Webb Space Telescope’s observational search for a planet around the nearest Sun-like star, Alpha Centauri A. The initial image shows the bright glare of Alpha Centauri A and Alpha Centauri B, then the middle panel shows the system with a coronagraphic mask placed over Alpha Centauri A to block its bright glare. However, the way the light bends around the edges of the coronagraph creates ripples of light in the surrounding space. The telescope’s optics (its mirrors and support structures) cause some light to interfere with itself, producing circular and spoke-like patterns. These complex light patterns, along with light from the nearby Alpha Centauri B, make it incredibly difficult to spot faint planets. In the panel at the right, astronomers have subtracted the known patterns (using reference images and algorithms) to clean up the image and reveal faint sources like the candidate planet.
Credit: NASA, ESA, CSA, STScI, A. Sanghi (Caltech), C. Beichman (JPL), D. Mawet (Caltech), J. DePasquale (STScI)

Researchers say a non-detection in the second and third round of observations with Webb isn’t surprising.

“We found that in half of the possible orbits simulated, the planet moved too close to the star and wouldn’t have been visible to Webb in both February and April 2025,” said Sanghi.

Based on the brightness of the planet in the mid-infrared observations and the orbit simulations, researchers say it could be a gas giant approximately the mass of Saturn orbiting Alpha Centauri A in an elliptical path varying between 1 to 2 times the distance between Sun and Earth.

“These are some of the most demanding observations we’ve done so far with MIRI’s coronagraph,” said Pierre-Olivier Lagage, of CEA, France, who is a co-author on the papers and was the French lead for the development of MIRI. “When we were developing the instrument we were eager to see what we might find around Alpha Centauri, and I’m looking forward to what it will reveal to us next!”

“If confirmed, the potential planet seen in the Webb image of Alpha Centauri A would mark a new milestone for exoplanet imaging efforts,” Sanghi says. “Of all the directly imaged planets, this would be the closest to its star seen so far. It’s also the most similar in temperature and age to the giant planets in our solar system, and nearest to our home, Earth,” he says. “Its very existence in a system of two closely separated stars would challenge our understanding of how planets form, survive, and evolve in chaotic environments.”

If confirmed by additional observations, the team’s results could transform the future of exoplanet science.

“This would become a touchstone object for exoplanet science, with multiple opportunities for detailed characterization by Webb and other observatories,” said Beichman.


Press release from ESA Webb.

Webb traces details of complex planetary nebula – More than one star contributes to the irregular shape of NGC 6072

Webb’s newest look at planetary nebula NGC 6072 in the near- and mid-infrared shows what may appear as a very messy scene resembling splattered paint. However, the unusual, asymmetrical scene hints at more complicated mechanisms underway, as the star central to the scene approaches the very final stages of its life and expels shells of material, losing up to 80 percent of its mass.

Since their discovery in the late 1700s, astronomers have learned that planetary nebulae, or the expanding shell of glowing gas expelled by a low-intermediate mass star late in its life, can come in all shapes and sizes. Most planetary nebulae present as circular, elliptical, or bi-polar, but some stray from the norm, as seen in new high-resolution images of the planetary nebula NGC 6072 by the NASA/ESA/CSA James Webb Space Telescope.

colourful mostly red image of near-infrared light from a glowing cloud with a distorted, asymmetrical shape, illuminated from within by a bright central star. The asymmetrical shape resembles paint splattered on the ground. In the centre of this image, a light blue glow casts over areas of dark pockets that appear dark blue and are traced with orange material. It has a clumpy appearance. The shells become a deeper red with distance from the centre. The shells appear as lobes that push gas toward the equatorial plane, forming a disc. The background of the image is black and speckled with tiny bright stars and distant galaxies.
The NASA/ESA/CSA James Webb Space Telescope’s view of planetary nebula NGC 6072 in the near-infrared shows a complex scene of multiple outflows expanding out at different angles from a dying star at the centre of the scene. These outflows push gas toward the equatorial plane, forming a disc.
Astronomers suspect there is at least one other star interacting with the material cast off by the central dying star, creating the abnormal appearance of this planetary nebula.
In this image, the red areas represent cool molecular gas, for example, molecular hydrogen.
Credit: NASA, ESA, CSA, STScI

In Webb’s NIRCam (Near-Infrared Camera) view of the object, it’s readily apparent that this nebula is multi-polar. This means there are several different elliptical outflows jetting out either way from the centre. These outflows compress gas towards the equatorial plane and create a disc. Astronomers say this is evidence that there are likely at least two stars at the centre of this scene. Specifically, a companion star is interacting with an aging star that had already begun to shed some of its outer layers of gas and dust.

The central region of the planetary nebula glows from the hot stellar core, seen as a light blue hue in near-infrared light. The dark orange material, which is made up of gas and dust, follows pockets or open areas that appear dark blue. This clumpiness could be created when dense molecules formed while being shielded from hot radiation from the central star. There could also be a time element at play. Over thousands of years, inner fast winds could be ploughing through the halo cast off from the main star when it first started to lose mass.

colourful, mostly blue, image of mid-infrared light from a glowing cloud with a distorted, asymmetrical shape. A star at the centre of the image is a small point of pinkish-white light. The asymmetrical shape of the expanding cloud of gas and dust resembles paint splattered on the ground. The filaments of the expanding shells are wispy, and mostly white and blue. The shells appear as lobes that push gas toward the equatorial plane, forming a disc. A perfect circle of white-ish blue dust traces the outer edges of the shells. The background of the image is black and speckled with tiny bright stars and distant galaxies.
The mid-infrared view of planetary nebula NGC 6072 from the NASA/ESA/CSA James Webb Space Telescope shows expanding circular shells around the outflows from the dying central star, which astronomers suspect is that pinkish white dot at the centre of the image. The longer wavelengths captured by Webb’s MIRI (Mid-Infrared Instrument) highlight the dust being cast off by the central dying star.
In this image, the blue represents cool molecular gas seen in red in the image from Webb’s NIRCam (Near-Infrared Camera) due to colour mapping.
Credit: NASA, ESA, CSA, STScI

The longer wavelengths captured by Webb’s MIRI (Mid-Infrared Instrument) are highlighting dust, revealing the star researchers suspect could be central to this scene. It appears as a small pink-white dot in this image. Webb’s look in the mid-infrared wavelength also reveals concentric rings expanding from the central region, the most obvious circling just past the edges of the lobes.

This may be additional evidence of a secondary star at the centre of the scene hidden from our view. The secondary star, as it circles repeatedly around the original star, could have carved out rings of material in a spiral pattern as the main star was expelling mass during an earlier stage of its life.

The red areas in NIRCam and blue areas in MIRI both trace cool molecular gas (likely molecular hydrogen) while central regions trace hot ionized gas.

Planetary nebulae will remain a topic of study for astronomers using Webb who hope to learn more about the full life cycle of stars and how they impact their surrounding environments. As the star at the centre of a planetary nebula cools and fades, the nebula will gradually dissipate into the interstellar medium — contributing enriched material that helps form new stars and planetary systems, now containing those heavier elements.

Webb’s imaging of NGC 6072 opens the door to studying how the planetary nebulae with more complex shapes contribute to this process.

Webb image of NGC 6072 with compass arrows, scale bar, and colour key. It has a mostly red image of near-infrared light from a glowing cloud with a distorted, asymmetrical shape, illuminated from within by a bright central star. In the centre of this image, a light blue glow casts over areas of dark pockets that appear dark blue and are traced with orange material. It has a clumpy appearance. The shells become a deeper red with distance from the center. At the bottom right is a scale bar labeled .5 light-years. The length of the scale bar is about one fifth of the total image. At the bottom right are compass arrows indicating the orientation of the image on the sky. Below the image is a colour key showing which NIRCam filters were used to create the image and which visible-light colour is assigned to each filter.
This image of NGC 6072, captured by the James Webb Space Telescope’s NIRCam (Near-Infrared Camera), shows compass arrows, scale bar, and colour key for reference.
The north and east compass arrows show the orientation of the image on the sky. Note that the relationship between north and east on the sky (as seen from below) is flipped to the direction arrows on a map of the ground (as seen from above). The scale bar is labeled in light-years, which is the distance that light travels in one Earth-year (it takes 0.5 years for light to travel a distance equal to the length of the scale bar). One light-year is equal to about 9.46 trillion kilometers. This image shows invisible near-infrared wavelengths of light that have been translated into visible-light colours. The colour key shows which NIRCam filters were used when collecting the light. The colour of each filter name is the visible light colour used to represent the infrared light that passes through that filter.
Credit: NASA, ESA, CSA, STScI

Press release from ESA Webb.

Webb captures evidence of a lightweight planet around TWA 7

Astronomers using the NASA/ESA/CSA James Webb Space Telescope have captured compelling evidence of a planet with a mass similar to Saturn orbiting the young nearby star TWA 7. If confirmed, this would represent Webb’s first direct image discovery of a planet, and the lightest planet ever seen with this technique.

The international team, led by Dr. Anne-Marie Lagrange, CNRS researcher at the Observatoire de Paris-PSL and Université Grenoble Alpes in France, detected a faint infrared source in the disc of debris surrounding TWA 7 using JWST’s Mid-Infrared Instrument (MIRI) and its coronagraph. The source is located about 1.5 arcseconds from the star on the sky which, at the distance of TWA7, is roughly fifty times the distance of the Earth to the Sun. This matches the expected position of a planet that would explain key features seen in the debris disc.

Using the coronagraph on Webb’s Mid-Infrared Instrument (MIRI) on 21 June 2024, the team carefully suppressed the bright glare of the host star to reveal faint nearby objects. This technique, called high-contrast imaging, enables astronomers to directly detect planets that would otherwise be lost in the overwhelming light from their host star. After subtracting residual starlight using advanced image processing, a faint infrared source was revealed near TWA 7, distinguishable from background galaxies or Solar System objects. The source is located in a gap in one of three dust rings that were discovered around TWA 7 by previous ground-based observations. Its brightness, colour, distance from the star, and position within the ring are consistent with theoretical predictions for a young, cold, Saturn-mass planet sculpting the surrounding debris disc.

“Our observations reveal a strong candidate for a planet shaping the structure of the TWA 7 debris disc, and its position is exactly where we expected to find a planet of this mass, said Dr. Lagrange.

“This observatory enables us to capture images of planets with masses similar to those in the solar system, which represents an exciting step forward in our understanding of planetary systems, including our own,” 

added co-author Mathilde Malin of Johns Hopkins University and the Space Telescope Science Institute in Baltimore.

Initial analysis suggests that the object — referred to as TWA 7b — could be a young, cold planet with a mass around 0.3 times that of Jupiter (~100 Earth masses) and a temperature near 320 Kelvin (roughly 47 degrees Celsius). Its location aligns with a gap in the disc, hinting at a dynamic interaction between the planet and its surroundings.

Debris discs filled with dust and rocky material are found around both young and older stars, although they are more easily detected around younger stars as they are brighter. They often feature visible rings or gaps, thought to be created by planets that have formed around the star, but such a planet has yet to be detected within a debris disc. Once verified, this discovery would mark the first time a planet has been directly associated with sculpting a debris disc and could offer the first observational hint of a trojan disc — a collection of dust trapped in the planet’s orbit.

TWA 7, also known as CE Antliae, is a young (~6.4 million years old) M-type star located about 111 light-years away in the TW Hydrae association. Its nearly face-on disc made it an ideal target for Webb’s high-sensitivity mid-infrared observations.

The findings highlight Webb’s ability to explore previously unseen, low-mass planets around nearby stars. Ongoing and future observations will aim to better constrain the properties of the candidate, verify its planetary status, and deepen our understanding of planet formation and disc evolution in young systems.This preliminary result showcases the exciting new frontier that JWST is opening for exoplanet discovery and characterisation.

These observations were taken as part of the Webb observing programme #3662. The results have been published today in Nature.

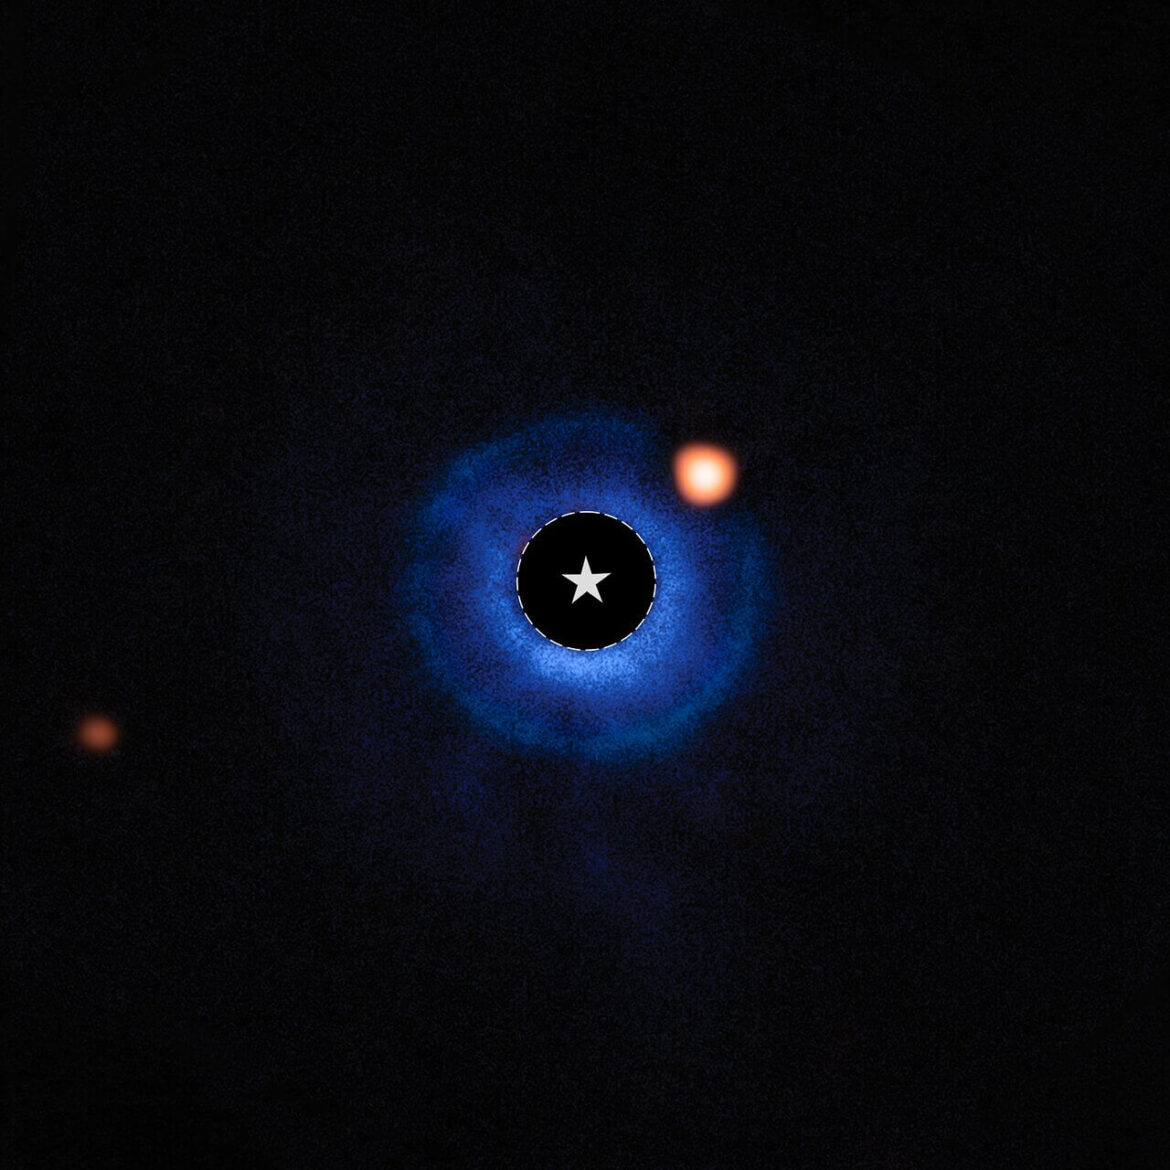
An image of a nearby star and its vicinity. The star itself has been blocked out and its bright light has been removed. A dashed circle with a star symbol at the centre of the image marks the star’s location. A fuzzy blue disc surrounds the star. An orange spot, near to the star and inside this disc, is identified as a planet orbiting the star. A fainter orange spot far from the centre marks a distant star.
Astronomers using the NASA/ESA/CSA James Webb Space Telescope have captured compelling evidence of a planet with a mass similar to Saturn orbiting the young nearby star TWA 7. If confirmed, this would represent Webb’s first direct image discovery of a planet, and the lightest planet ever seen with this technique. Using the coronagraph on Webb’s Mid-Infrared Instrument (MIRI) on 21 June 2024, the team carefully suppressed the bright glare of the host star to reveal faint nearby objects. This technique, called high-contrast imaging, enables astronomers to directly detect planets that would otherwise be lost in the overwhelming light from their host star. After subtracting residual starlight using advanced image processing, a faint infrared source was revealed near TWA 7, distinguishable from background galaxies or Solar System objects. The source is located in a gap in one of three dust rings that were discovered around TWA 7 by previous ground-based observations. Its brightness, colour, distance from the star, and position within the ring are consistent with theoretical predictions for a young, cold, Saturn-mass planet sculpting the surrounding debris disc. Initial analysis suggests that the object — referred to as TWA 7b — could be a young, cold planet with a mass around 0.3 times that of Jupiter (~100 Earth masses) and a temperature near 320 Kelvin (roughly 47 degrees Celsius). In this image from MIRI, light from the star TWA 7 has been subtracted. The location of the star is marked with a circle and a star symbol at the centre of the image. This leaves light from the debris disc around the star, as well as other infrared sources, visible. The bright spot to the upper right of the star is the source identified as TWA 7b, within the debris disc. The more distant orange spot visible in the left of the image is an unrelated background star. Only a single MIRI band was used in this image (seen here in orange). The blue colour visible in the image results from an additional band taken by the SPHERE instrument of ESO’s Very Large Telescope (VLT), which showcases the location of the disc surrounding the host star and the exoplanet creating a gap within the disc that is revealed by MIRI.
Credit: ESA/Webb, NASA, CSA, A.M. Lagrange, M. Zamani (ESA/Webb)


Bibliographic information:

Lagrange, AM., Wilkinson, C., Mâlin, M. et al. Evidence for a sub-Jovian planet in the young TWA 7 disk, Nature (2025), DOI: https://doi.org/10.1038/s41586-025-09150-4

Press release from ESA Webb.

Webb unmasks true nature of Herbig-Haro 49/50, the Cosmic Tornado

Webb’s exquisite details reveal a chance, random alignment of a protostellar outflow and a distant spiral galaxy.

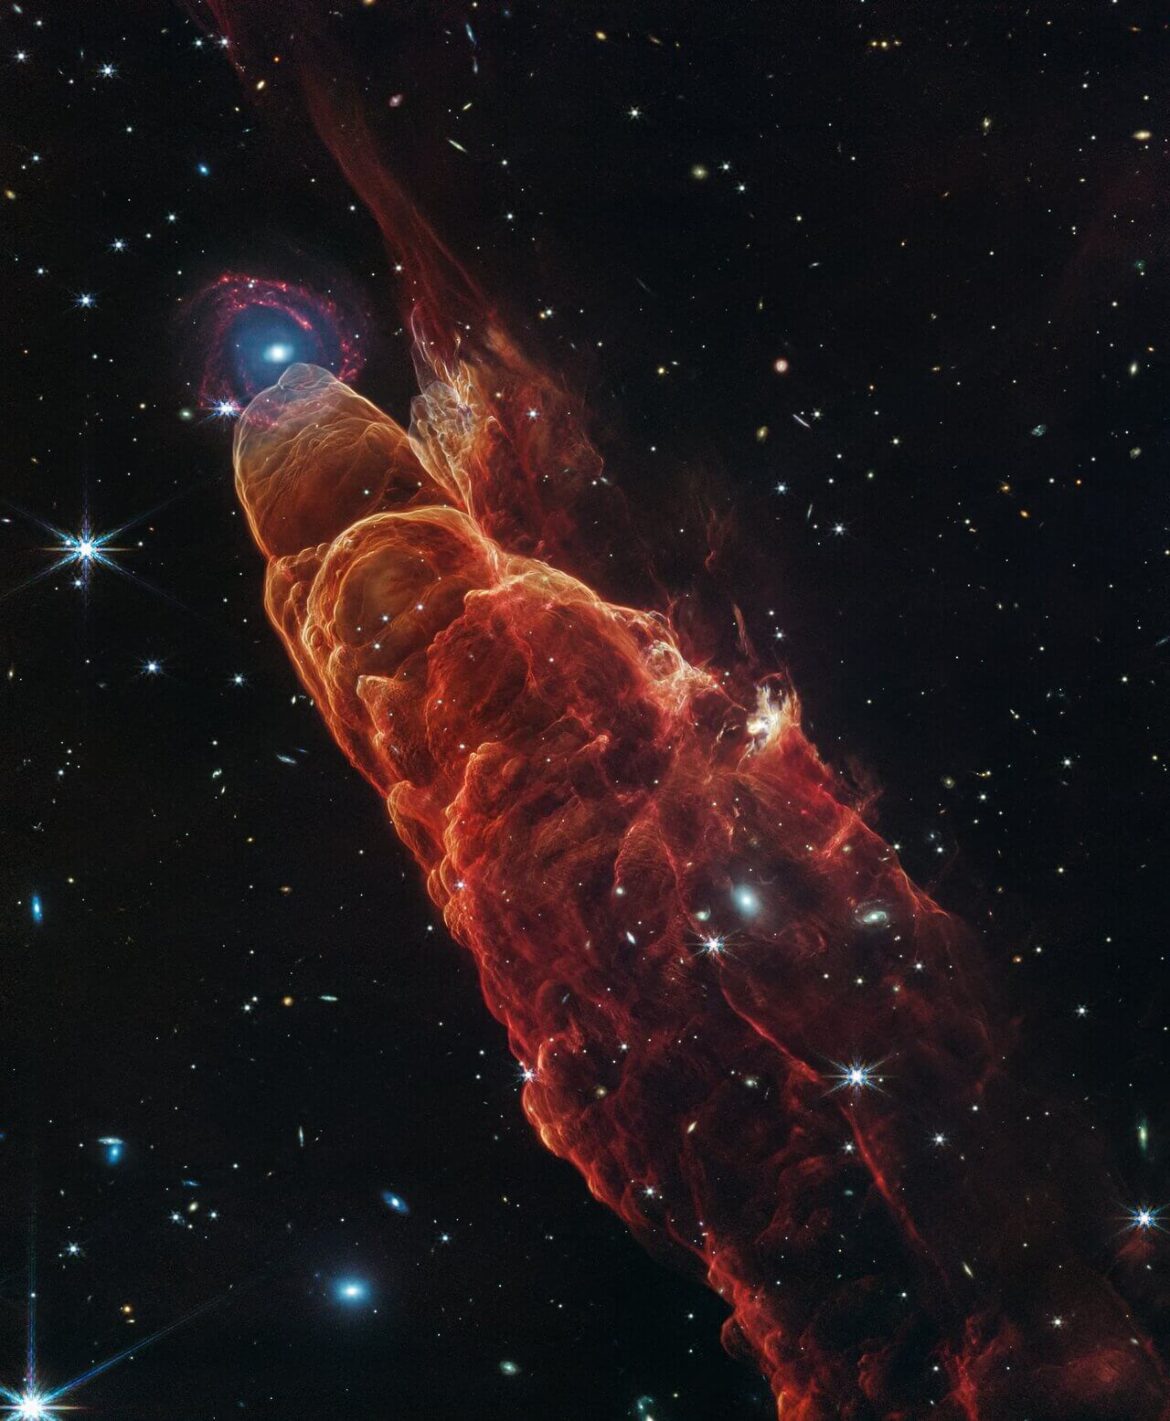
The NASA/ESA/CSA James Webb Space Telescope has captured a beautiful juxtaposition of the nearby protostellar outflow known as Herbig-Haro 49/50 with a perfectly positioned, more distant spiral galaxy. Due to the close proximity of this Herbig-Haro object to the Earth, this new composite infrared image of the outflow from a young star allows researchers to examine details on small spatial scales like never before. With Webb, we can better understand how the jet activity associated with the formation of young stars can affect their surrounding environment.

Angled from the upper left corner to the lower right corner of the image is a conical shaped orange-red cloud known at Herbig-Haro 49/50. This feature takes up about three-fourths of the length of this angle. The upper left end of this feature has a translucent, rounded end. At this same location there is a background spiral shaped galaxy with a concentrated blue center that fades outwards to blend in with red spiral arms. The conical feature widens slightly from the rounded end at the upper right down to the lower right. The black background of space is clearer, speckled with some white stars and smaller, more numerous, fainter white galaxies.
The NASA/ESA/CSA James Webb Space Telescope observed Herbig-Haro 49/50, an outflow from a nearby still-forming star, in high-resolution near- and mid-infrared light with the NIRCam and MIRI instruments. The intricate features of the outflow, represented in reddish-orange color, provide detailed clues about how young stars form and how their jet activity affects the environment around them. A chance alignment in this direction of the sky provides a beautiful juxtaposition of this nearby Herbig-Haro object (located within our Milky Way) with a more distant, face-on spiral galaxy in the background.
Protostars are young stars in the process of formation that generally launch narrow jets of material. These jets move through the surrounding environment, in some cases extending to large distances away from the protostar. Like the water wake generated by a speeding boat, the arcs in this image are created by the fast-moving jet slamming into surrounding dust and gas. This ambient material is compressed and heats up, then cools by emitting light at visible and infrared wavelengths. In particular, the infrared light captured here by Webb highlights molecular hydrogen and carbon monoxide.
The galaxy that appears by happenstance at the tip of Herbig-Haro 49/50 is a much more distant spiral galaxy. It has a prominent central bulge represented in blue that shows the location of older stars. It also displays hints of “side lobes,” suggesting that this could be a barred-spiral galaxy. Reddish clumps within the spiral arms show the locations of warm dust and groups of forming stars.
In the image background there are many more galaxies at further distances, including galaxies that shine through the diffuse infrared glow of the nearby Herbig-Haro object.
Credit: NASA, ESA, CSA, STScI

This new composite image combines observations from Webb’s NIRCam (Near-Infrared Camera) and MIRI (Mid-Infrared Instrument), which provides a high-resolution view to explore the exquisite details of this bubbling activity. Herbig-Haro 49/50 is located about 630 light-years from Earth in the constellation Chamaeleon.

Herbig-Haro objects are outflows produced by jets launched from a nearby, forming star. The outflows, which can extend for light-years, plow into a denser region of material. This creates shock waves, heating the material to higher temperatures. The material then cools by emitting light at visible and infrared wavelengths.

When NASA’s Spitzer Space Telescope observed it in 2006, scientists nicknamed Herbig-Haro 49/50 (HH 49/50) the “Cosmic Tornado” for its helical appearance, but they were uncertain about the nature of the fuzzy object at the tip of the “tornado.” With its higher imaging resolution, Webb provides a different visual impression of HH 49/50 by revealing fine features of the shocked regions in the outflow, uncovering the fuzzy object to be a distant spiral galaxy, and displaying a sea of distant background galaxies.

HH 49/50 is located in the Chamaeleon I Cloud complex, one of the nearest active star formation regions in our Milky Way, which is creating numerous low-mass stars similar to our Sun. This cloud complex is likely similar to the environment that our Sun formed in. Past observations of this region show that the HH 49/50 outflow is moving away from us at speeds of 100-300 kilometres per second and is just one feature of a larger outflow.

Webb’s NIRCam and MIRI observations of HH 49/50 trace the location of glowing hydrogen molecules, carbon monoxide molecules, and energised grains of dust, represented in orange and red, as the protostellar jet slams into the region. Webb’s observations probe details on small spatial scales that will help astronomers to model the properties of the jet and understand how it is affecting the surrounding material.

The arc-shaped features in HH 49/50, similar to a water wake created by a speeding boat, point back to the source of this outflow. Based on past observations, scientists suspect that a protostar known as Cederblad 110 IRS4 is a plausible driver of the jet activity. Located roughly 1.5 light-years away from HH 49/50 (off the lower right corner of the Webb image), CED 110 IRS4 is a Class I protostar. Class I protostars are young objects (tens of thousands to a million years old) in the prime time of gaining mass. They usually have a discernible disk of material surrounding it that is still falling onto the protostar. Scientists recently used Webb’s NIRCam and MIRI observations to study this protostar and obtain an inventory of the icy composition of its environment.

These detailed Webb images of the arcs in HH 49/50 can more precisely pinpoint the direction to the jet source, but not every arc points back in the same direction. For example, there is an interesting outcrop feature (at the top right of the main outflow) which could be another chance superposition of a different outflow, related to the slow precession of the intermittent jet source. Alternatively, this feature could be a result of the main outflow breaking apart.

The galaxy that appears by happenstance at the tip of HH 49/50 is a much more distant, face-on spiral galaxy. It has a prominent central bulge represented in blue that shows the location of older stars. The bulge also shows hints of “side lobes” suggesting that this could be a barred-spiral galaxy. Reddish clumps within the spiral arms show the locations of warm dust and groups of forming stars. The galaxy even displays evacuated bubbles in these dusty regions, similar to nearby galaxies observed by Webb as part of the PHANGS program.

Webb has captured these two unassociated objects in a lucky alignment. Over thousands of years, the edge of HH 49/50 will move outwards and eventually appear to cover up the distant galaxy.

Angled from the upper left corner to the lower right corner of the image is a conical shaped orange-red cloud known at Herbig-Haro 49/50. This feature takes up about three-fourths of the length of this angle. The upper left end of this feature has a translucent, rounded end. At this same location there is a background spiral shaped galaxy with a concentrated blue center that fades outwards to blend in with red spiral arms. The conical feature widens slightly from the rounded end at the upper right down to the lower right. The black background of space is clearer, speckled with some white stars and smaller, more numerous, fainter white galaxies.
The NASA/ESA/CSA James Webb Space Telescope observed Herbig-Haro 49/50, an outflow from a nearby still-forming star, in high-resolution near- and mid-infrared light with the NIRCam and MIRI instruments. The intricate features of the outflow, represented in reddish-orange color, provide detailed clues about how young stars form and how their jet activity affects the environment around them. A chance alignment in this direction of the sky provides a beautiful juxtaposition of this nearby Herbig-Haro object (located within our Milky Way) with a more distant, face-on spiral galaxy in the background. Protostars are young stars in the process of formation that generally launch narrow jets of material. These jets move through the surrounding environment, in some cases extending to large distances away from the protostar. Like the water wake generated by a speeding boat, the arcs in this image are created by the fast-moving jet slamming into surrounding dust and gas. This ambient material is compressed and heats up, then cools by emitting light at visible and infrared wavelengths. In particular, the infrared light captured here by Webb highlights molecular hydrogen and carbon monoxide. The galaxy that appears by happenstance at the tip of Herbig-Haro 49/50 is a much more distant spiral galaxy. It has a prominent central bulge represented in blue that shows the location of older stars. It also displays hints of “side lobes,” suggesting that this could be a barred-spiral galaxy. Reddish clumps within the spiral arms show the locations of warm dust and groups of forming stars. In the image background there are many more galaxies at further distances, including galaxies that shine through the diffuse infrared glow of the nearby Herbig-Haro object. Credit: NASA, ESA, CSA, STScI

Press release from ESA Webb.

Webb exposes complex atmosphere of SIMP 0136, a starless super-Jupiter

An international team of researchers has discovered that previously observed variations in brightness across a free-floating planetary-mass object known as SIMP 0136 must be the result of a complex combination of atmospheric factors, and cannot be explained by clouds alone.

Using the NASA/ESA/CSA James Webb Space Telescope to monitor a broad spectrum of infrared light emitted by SIMP 0136 over two full rotation periods, the team was able to detect variations in cloud layers, temperature, and carbon chemistry that were previously hidden from view. The results provide crucial insight into the three-dimensional complexity of gas giant atmospheres within and beyond our solar system.

Rapidly rotating, free-floating

SIMP 0136 is a rapidly rotating, free-floating object roughly 13 times the mass of Jupiter, located in the Milky Way just 20 light-years from Earth. Although it is not classified as a gas giant exoplanet — it doesn’t orbit a star and may instead be a brown dwarf — SIMP 0136 is an ideal target for exo-meteorology: It is the brightest object of its kind in the northern sky. Because it is isolated, it can be observed directly and with no fear of light contamination or variability caused by a host star. And its short rotation period of just 2.4 hours makes it possible to survey very efficiently.

Prior to the Webb observations, SIMP 0136 had been studied extensively using ground-based observatories, as well as and NASA’s Spitzer Space Telescope and the NASA/ESA Hubble Space Telescope.

“We already knew that it varies in brightness, and we were confident that there are patchy cloud layers that rotate in and out of view and evolve over time,” explained Allison McCarthy, doctoral student at Boston University and lead author on a study published today in The Astrophysical Journal Letters“We also thought there could be temperature variations, chemical reactions, and possibly some effects of auroral activity affecting the brightness, but we weren’t sure.”

To figure it out, the team needed Webb’s ability to measure very precise changes in brightness over a broad range of wavelengths.

Charting thousands of infrared rainbows

Using NIRSpec (Near-Infrared Spectrograph), Webb captured thousands of individual 0.6- to 5.3-micron spectra — one every 1.8 seconds over more than three hours as the object completed one full rotation. This was immediately followed by an observation with MIRI (Mid-Infrared Instrument), which collected hundreds of measurements of 5- to 14-micron light — one every 19.2 seconds, over another rotation.

The result was hundreds of detailed light curves, each showing the change in brightness of a very precise wavelength (color) as different sides of the object rotated into view.

“To see the full spectrum of this object change over the course of minutes was incredible,” said principal investigator Johanna Vos, from Trinity College Dublin. “Until now, we only had a little slice of the near-infrared spectrum from Hubble, and a few brightness measurements from Spitzer.”

The team noticed almost immediately that there were several distinct light-curve shapes. At any given time, some wavelengths were growing brighter, while others were becoming dimmer or not changing much at all. A number of different factors must be affecting the brightness variations.

“Imagine watching Earth from far away. If you were to look at each color separately, you would see different patterns that tell you something about its surface and atmosphere, even if you couldn’t make out the individual features,” explained co-author Philip Muirhead, also from Boston University. “Blue would increase as oceans rotate into view. Changes in brown and green would tell you something about soil and vegetation.”

Illustration of a gas giant planet or brown dwarf on a background of distant stars.
This artist’s concept shows what the isolated planetary-mass object SIMP 0136 could look like based on recent observations from the NASA/ESA/CSA James Webb Space Telescope.
SIMP 0136 has a mass about 13 times that of Jupiter. Although it is thought to have the structure and composition of a gas giant, it is not technically classified as an exoplanet because it doesn’t orbit its own star.
The colors shown in the illustration represent near-infrared light, which is invisible to human eyes. SIMP 0136 is relatively warm — about 825 degrees Celsius or 1,100 kelvins — but is not hot enough to give off enough visible light to see from Earth, and is not illuminated by a host star. The bluish glow near the poles represents auroral energy (light given off by electrons spiraling in a magnetic field) which has been detected at radio wavelengths.
Researchers used NIRSpec (Near-infrared Spectrograph) and MIRI (Mid-Infrared Instrument) to monitor the brightness of SIMP 0136 over two full rotations in July 2023. By analyzing the change in brightness of different wavelengths over time, researchers were able to detect variability in cloud cover at different depths, temperature variations in the high atmosphere, and changes in carbon chemistry as different sides of the object rotated in and out of view.
SIMP 0136 is located within the Milky Way, about 20 light-years from Earth, in the constellation Pisces. It is the brightest isolated planet or brown dwarf visible from the Northern Hemisphere, and is thought to be about 200 million years old. This illustration is based on spectroscopic observations. Webb has not captured a direct image of the object.
Credit: NASA, ESA, CSA, J. Olmsted (STScI)

Patchy clouds, hot spots, and carbon chemistry

To figure out what could be causing the variability on SIMP 0136, the team used atmospheric models to show where in the atmosphere each wavelength of light was originating.

“Different wavelengths provide information about different depths in the atmosphere,” explained McCarthy. “We started to realize that the wavelengths that had the most similar light-curve shapes also probed the same depths, which reinforced this idea that they must be caused by the same mechanism.”

One group of wavelengths, for example, originates deep in the atmosphere where there could be patchy clouds made of iron particles. A second group comes from higher clouds thought to be made of tiny grains of silicate minerals. The variations in both of these light curves are related to patchiness of the cloud layers.

A third group of wavelengths originates at very high altitude, far above the clouds, and seems to track temperature. Bright “hot spots” could be related to auroras that were previously detected at radio wavelengths, or to upwelling of hot gas from deeper in the atmosphere.

Some of the light curves cannot be explained by either clouds or temperature, but instead show variations related to atmospheric carbon chemistry. There could be pockets of carbon monoxide and carbon dioxide rotating in and out of view, or chemical reactions causing the atmosphere to change.

“We haven’t really figured out the chemistry part of the puzzle yet,” said Vos. “But these results are really exciting because they are showing us that the abundances of molecules like methane and carbon dioxide could change from place to place and over time. If we are looking at an exoplanet and can get only one measurement, we need to consider that it might not be representative of the entire planet.”

This research was conducted as part of Webb’s General Observer (GO) Program 3548.

Bibliographic information:

Allison M. McCarthy et al 2025, ApJL 981 L22, DOI: 10.3847/2041-8213/ad9eaf

The graphic has two parts. On the left are light curves showing the change in brightness of three sets of near-infrared wavelengths over time. On the right is a cross-section of the object’s atmosphere, showing the altitude that each set of wavelengths originates and their relationship to cloud layers or temperature.
These light curves show the change in brightness of three different sets of wavelengths (colors) of near-infrared light coming from the isolated planetary-mass object SIMP 0136 as it rotated. The light was captured by Webb’s NIRSpec (Near-Infrared Spectrograph), which collected a total of 5,726 spectra — one every 1.8 seconds — over the course of about 3 hours on 23 July 2023 (SIMP 0136 completes one rotation every 2.4 hours).
By comparing these light curves to models, researchers were able to show that each set of wavelengths probes different depths (pressures) in the atmosphere.
The curve shown in red tracks the brightness of 0.9- to 1.4-micron light thought to originate deep in the atmosphere at a pressure of about 10 bars (about 10 times the air pressure at sea level on Earth), within clouds made of iron particles. The curve shown in yellow tracks the brightness of 1.4- to 2.3-micron light from a pressure of about 1 bar within higher clouds made of tiny grains of silicate minerals. The variations in brightness shown by these two curves is related to patchiness of the cloud layers, which emit some wavelengths of light and absorb others.
The curve shown in blue tracks the brightness of 3.3- to 3.6-micron light that originates high above the clouds at a pressure of about 0.1 bars. Changes in brightness of these wavelengths are related to variations in temperature around the object. Bright “hot spots” could be related to auroras that have been detected at radio wavelengths, or to upwelling of hot gas from deeper in the atmosphere.
The differences in shape of these three light curves show that there are complex variations in SIMP 0136’s atmosphere with depth as well as longitude. If the atmosphere varied around the object in the same way at all depths, the light curves would have similar patterns. If it varied with depth, but not longitude, the light curves would be straight, flat lines.
Note this graph shows the relative change in brightness for each given set of wavelengths over time, not the difference in absolute brightness between the different sets. At any given time, there is more light coming from the deep atmosphere (red light curve) than from the upper atmosphere (blue light curve).
SIMP 0136 is located within the Milky Way, about 20 light-years from Earth, in the constellation Pisces. It is the brightest isolated planet or brown dwarf visible from the Northern Hemisphere, and is thought to be about 200 million years old. The artist’s concepts are based on spectroscopic observations. Webb has not captured a direct image of the object.
Credit: NASA, ESA, CSA, J. Olmsted (STScI)

Press release from ESA Webb.

Massive black hole in the early universe spotted taking a ‘nap’ after overeating, and lying dormant in its host galaxy, GN-1001830

JWST buco nero dormiente GN-1001830 Illustrazione artistica che rappresenta l'aspetto potenziale del buco nero supermassiccio scoperto dal team di ricerca durante la sua fase di intensa attività super-Eddington. Crediti: Jiarong Gu
A study in Nature finds that black holes in the early Universe go through short periods of ultra-fast growth, followed by long periods of dormancy. Picture credits: Jiarong Gu

Scientists have spotted a massive black hole in the early universe that is ‘napping’ after stuffing itself with too much food.

Like a bear gorging itself on salmon before hibernating for the winter, or a much-needed nap after Christmas dinner, this black hole has overeaten to the point that it is lying dormant in its host galaxy, GN-1001830.

An international team of astronomers, led by the University of Cambridge, used the NASA/ESA/CSA James Webb Space Telescope to detect this black hole in the early universe, just 800 million years after the Big Bang.

The black hole is huge – 400 million times the mass of our Sun – making it one of the most massive black holes discovered by Webb at this point in the universe’s development. The black hole is so enormous that it makes up roughly 40% of the total mass of its host galaxy: in comparison, most black holes in the local universe are roughly 0.1% of their host galaxy mass.

However, despite its gigantic size, this black hole is eating, or accreting, the gas it needs to grow at a very low rate – about 100 times below its theoretical maximum limit – making it essentially dormant.

Such an over-massive black hole so early in the universe, but one that isn’t growing, challenges existing models of how black holes develop. However, the researchers say that the most likely scenario is that black holes go through short periods of ultra-fast growth, followed by long periods of dormancy. Their results are reported in the journal Nature.

When black holes are ‘napping’, they are far less luminous, making them more difficult to spot, even with highly-sensitive telescopes such as Webb. Black holes cannot be directly observed, but instead they are detected by the tell-tale glow of a swirling accretion disc, which forms near the black hole’s edges. The gas in the accretion disc becomes extremely hot and starts to glow and radiate energy in the ultraviolet range.

“Even though this black hole is dormant, its enormous size made it possible for us to detect,” said lead author Ignas Juodžbalis from Cambridge’s Kavli Institute for Cosmology. “Its dormant state allowed us to learn about the mass of the host galaxy as well. The early universe managed to produce some absolute monsters, even in relatively tiny galaxies.”

According to standard models, black holes form from the collapsed remnants of dead stars and accrete matter up to a predicted limit, known as the Eddington limit, where the pressure of radiation on matter overcomes the gravitational pull of the black hole. However, the sheer size of this black hole suggests that standard models may not adequately explain how these monsters form and grow.

“It’s possible that black holes are ‘born big’, which could explain why Webb has spotted huge black holes in the early universe,” said co-author Professor Roberto Maiolino, from the Kavli Institute and Cambridge’s Cavendish Laboratory. “But another possibility is they go through periods of hyperactivity, followed by long periods of dormancy.”

Working with colleagues from Italy, the Cambridge researchers conducted a range of computer simulations to model how this dormant black hole could have grown to such a massive size so early in the universe. They found that the most likely scenario is that black holes can exceed the Eddington limit for short periods, during which they grow very rapidly, followed by long periods of inactivity: the researchers say that black holes such as this one likely eat for five to ten million years, and sleep for about 100 million years.

“It sounds counterintuitive to explain a dormant black hole with periods of hyperactivity, but these short bursts allow it to grow quickly while spending most of its time napping,” said Maiolino.

Because the periods of dormancy are much longer than the periods of ultra-fast growth, it is in these periods that astronomers are most likely to detect black holes.

“This was the first result I had as part of my PhD, and it took me a little while to appreciate just how remarkable it was,” said Juodžbalis. “It wasn’t until I started speaking with my colleagues on the theoretical side of astronomy that I was able to see the true significance of this black hole.”

Due to their low luminosities, dormant black holes are more challenging for astronomers to detect, but the researchers say this black hole is almost certainly the tip of a much larger iceberg, if black holes in the early universe spend most of their time in a dormant state.

“It’s likely that the vast majority of black holes out there are in this dormant state – I’m surprised we found this one, but I’m excited to think that there are so many more we could find,” said Maiolino.

The observations were obtained as part of the JWST Advanced Deep Extragalactic Survey (JADES). The research was supported in part by the European Research Council and the Science and Technology Facilities Council (STFC), part of UK Research and Innovation (UKRI).


Bibliographic Information:

“A dormant, overmassive black hole in the early Universe”, by Ignas Juodžbalis, Roberto Maiolino, William M. Baker, Sandro Tacchella, Jan Scholtz, Francesco D’Eugenio, Raffaella Schneider, Alessandro Trinca, Rosa Valiante, Christa DeCoursey, Mirko Curti, Stefano Carniani, Jacopo Chevallard, Anna de Graaff, Santiago Arribas, Jake S. Bennett, Martin A. Bourne, Andrew J. Bunker, Stephane Charlot, Brian Jiang, Sophie Koudmani, Michele Perna, Brant Robertson, Debora Sijacki, Hannah Ubler, Christina C. Williams, Chris Willott, Joris Witstok, has been published on Nature (18-Dec-2024).

Press release from the University of Cambridge

The Sombrero Galaxy, also known as Messier 104 (M104), dazzles in new mid-infrared image from Webb 

A new mid-infrared image from the NASA/ESA/CSA James Webb Space Telescope features the Sombrero galaxy, also known as Messier 104 (M104). The signature, glowing core seen in visible-light images does not shine, and instead a smooth inner disk is revealed. The sharp resolution of Webb’s MIRI (Mid-Infrared Instrument) also brings into focus details of the galaxy’s outer ring, providing insights into how the dust, an essential building block for astronomical objects in the Universe, is distributed. The galaxy’s outer ring shows intricate clumps in the infrared for the first time.

Image of a galaxy on the black background of space. The galaxy is a very oblong, blue disk that extends from left to right at an angle (from about 10 o’clock to 5 o’clock). The galaxy has a small bright core at the centre. There is an inner disk that is clearer, with speckles of stars scattered throughout. The outer disk of the galaxy is whiteish-blue, and clumpy, like clouds in the sky. There are different coloured dots, distant galaxies, speckled among the black background of space surrounding the galaxy.
The NASA/ESA/CSA James Webb Space Telescope recently imaged the Sombrero galaxy with its MIRI (Mid-Infrared Instrument), resolving the clumpy nature of the dust along the galaxy’s outer ring.
The mid-infrared light highlights the gas and dust that are part of star formation taking place among the Sombrero galaxy’s outer disk. The rings of the Sombrero galaxy produce less than one solar mass of stars per year, in comparison to the Milky Way’s roughly two solar masses a year. It’s not a particular hotbed of star formation.
The Sombrero galaxy is around 30 million light-years from Earth in the constellation Virgo.
Credit: NASA, ESA, CSA, STScI

Researchers say the clumpy nature of the dust, where MIRI detects carbon-containing molecules called polycyclic aromatic hydrocarbons, can indicate the presence of young star-forming regions. However, unlike some galaxies studied with Webb, including Messier 82, where 10 times as many stars are born as in the Milky Way galaxy, the Sombrero galaxy is not a particular hotbed of star formation. The rings of the Sombrero galaxy produce less than one solar mass of stars per year, in comparison to the Milky Way’s roughly two solar masses a year.

The supermassive black hole at the centre of the Sombrero galaxy, also known as an active galactic nucleus (AGN), is rather docile, even at a hefty 9-billion-solar masses. It’s classified as a low luminosity AGN, slowly snacking on infalling material from the galaxy, while sending off a bright, relatively small, jet.

Also within the Sombrero galaxy dwell some 2000 globular clusters, a collection of hundreds of thousands of old stars held together by gravity. This type of system serves as a pseudo laboratory for astronomers to study stars – thousands of stars within one system with the same age, but varying masses and other properties is an intriguing opportunity for comparison studies.

In the MIRI image, galaxies of varying shapes and colours litter the background of space. The different colours of these background galaxies can tell astronomers about their properties, including how far away they are.

The Sombrero galaxy is around 30 million light-years from Earth in the constellation Virgo.

Stunning images like this, and an array of discoveries in the study of exoplanets, galaxies through time, star formation, and our own Solar System, are still just the beginning. Recently, scientists from all over the world converged—virtually—to apply for observation time with Webb during its fourth year of science operations, which begins in July 2025.

A two panel image. The top image is Webb’s view of the Sombrero galaxy, the bottom image is Hubble’s view. In the Webb view, the galaxy is a very oblong, blue disk that extends from left to right at an angle (from about 10 o’clock to 5 o’clock). The galaxy has a small bright core at the centre. There is a clear inner disk that has speckles of stars scattered throughout. The outer disk of the galaxy is whiteish-blue, and clumpy, like clouds in the sky. In the Hubble view, the galaxy is an oblong, pale white disk with a glowing core over the inner disk. The outer disk is darker and clumpy.
This image compares the view of the famous Sombrero Galaxy in mid-infrared light (top) and visible light (bottom). The James Webb Space Telescope’s MIRI (Mid-Infrared Instrument) reveals the smooth inner disk of the galaxy, while the Hubble Space Telescope’s visible light image shows the large and extended glow of the central bulge of stars.
Both the Webb and Hubble images resolve the clumpy nature of the dust that makes up the Sombrero galaxy’s outer ring.
Credit: NASA, ESA, CSA, STScI, Hubble Heritage Team (STScI/AURA)

General Observer time with Webb is more competitive than ever. A record-breaking 2377 proposals were submitted by the 15 October 2024 deadline, requesting about 78,000 hours of observation time. This is an oversubscription rate, the ratio defining the observation hours requested versus the actual time available in one year of Webb’s operations, of around 9 to 1.

The proposals cover a wide array of science topics, with distant galaxies being among the most requested observation time, followed by exoplanet atmospheres, stars and stellar population, then exoplanet systems.

Press release from ESA Webb

Webb provides another look into galactic collisions at Arp 107

An interaction between an elliptical galaxy and a larger spiral galaxy, collectively known as Arp 107, seems to have given the spiral a happier outlook thanks to the two bright ‘eyes’ and the wide semicircular ‘smile’ that have resulted. This image is a composite, combining observations from Webb’s MIRI (Mid-InfraRed Instrument) and NIRCam (Near-InfraRed Camera).

NIRCam highlights the stars within both galaxies and reveals the connection between them: a transparent, white bridge of stars pulled from both galaxies during their passage. MIRI data, represented in orange-red, show star-forming regions and dust that is composed of soot-like organic molecules known as polycyclic aromatic hydrocarbons. MIRI also provides a snapshot of the bright nucleus of the large spiral, home to a supermassive black hole.

A pair of interacting galaxies. The larger of the two galaxies is slightly right of centre, and is composed of a bright, white centre and a ring of blue, gaseous filaments. The centre of this galaxy shows Webb’s eight-pronged diffraction pattern. There are three filaments of gas and dust moving from the ring toward the centre. At the top left of the ring is a noticeable gap, bordered by two large, blue pockets of dust and gas. The smaller galaxy is made of hazy, light blue gas and dust. Many red, green, blue, and yellow galaxies are spread throughout, with some being hazier in composition and others having more defined spiral patterns.
This image of Arp 107, obtained by Webb’s MIRI (Mid-InfraRed Instrument), reveals the supermassive black hole that lies in the centre of the large spiral galaxy to the right, as evidenced by the small, bright central ‘core’. This bright core, where the black hole is pulling much of the dust into lanes, also features Webb’s characteristic diffraction spikes, caused by the light that it emits interacting with the structure of the telescope itself.
Perhaps the defining feature of the region, which MIRI reveals, are the millions of young stars that are forming, highlighted in blue. These stars are surrounded by dusty silicates and soot-like molecules known as polycyclic aromatic hydrocarbons. The small elliptical galaxy to the left, which has already completed much of its star formation, is composed of many of these organic molecules.
Credit: NASA, ESA, CSA, STScI

The spiral galaxy is classified as a Seyfert galaxy, one of the two largest groups of active galaxies, along with galaxies that host quasars. Seyfert galaxies aren’t as luminous or as distant as quasars, so they are better places to study similar phenomena in lower-energy light, like infrared.

This region is much like the Cartwheel Galaxy, one of the first interacting galaxies that Webb observed. Arp 107 may have turned out very similar in appearance to the Cartwheel, but since the smaller elliptical galaxy had an off-centre collision instead of a direct hit, the spiral galaxy got away with only its spiral arms being disturbed.

A pair of interacting galaxies. The larger of the two galaxies is slightly right of centre, and is composed of a hazy, bright, white centre and a ring of gaseous filaments, which are different shades of red and orange. Toward the bottom left and bottom right of the ring are filaments of gas spiralling inward toward the core. At the top left of the ring is a noticeable gap, bordered by two large, orange pockets of dust and gas. The smaller galaxy is made of hazy and white gas and dust, which become more diffuse further away from its centre. To this galaxy’s bottom left, there is a smaller, more diffuse gas cloud that wafts outward toward the edges of the image. Many red, orange, and white galaxies are spread throughout, with some being hazier in appearance and others having more defined spiral patterns.
This composite image of Arp 107, created with data from the James Webb Space Telescope’s NIRCam (Near-InfraRed Camera) and MIRI (Mid-InfraRed Instrument), reveals a wealth of information about the star formation taking place in these two galaxies and how they collided hundreds of million years ago.
The near-infrared data, shown in white, show older stars, which shine brightly in both galaxies, as well as the tenuous gas bridge that runs between them. The vibrant background galaxies are also brightly illuminated at these wavelengths.
On the other hand, MIRI data show the young stars and star-forming regions in vibrant orange and red. Our view in the mid-infrared provides the best view of the collision point, given the noticeable gap at the top of the spiral galaxy. This collision not only began a new bout of star formation in the region, but also produced an endearing smile.
Credit: NASA, ESA, CSA, STScI

The collision isn’t as bad as it sounds. Although there was much star formation occurring before, collisions between galaxies can compress gas, improving the conditions needed for more stars to form. On the other hand, as Webb reveals, collisions also disperse a lot of gas, potentially depriving new stars of the material they need to form.

Webb has captured these galaxies in the process of merging, which will take hundreds of millions of years. As the two galaxies rebuild after the chaos of their collision, Arp 107 may lose its smile, but it will inevitably turn into something just as interesting for future astronomers to study.

Arp 107 is located 465 million light-years from Earth in the constellation Leo Minor.

A pair of interacting galaxies. At the bottom left are compass arrows indicating the orientation of the image on the sky. The north arrow points in the 10 o’clock direction. The east arrow points toward 6 o’clock. At the lower right is a scale bar labelled in light-years. The length of the scale bar is one-sixth the total width of the image. Below the image is a colour key showing which NIRCam filters were used to create the image and which visible-light colour is assigned to each filter. From left to right, the NIRCam filters are: F090W is blue; F150W is blue; F200W is green; F277W is green; F356W is red; and F444W is red. From left to right, the MIRI filters are: F770W is yellow; F1000W is orange; and F1500W is red.
The north and east compass arrows show the orientation of the image on the sky. Note that the relationship between north and east on the sky (as seen from below) is flipped relative to the direction arrows on a map of the ground (as seen from above).
The scale bar is labelled in light-years, which is the distance that light travels in one Earth-year. (It takes 75 000 years for light to travel a distance equal to the length of the bar.) One light-year is equal to about 5.88 trillion miles or 9.46 trillion kilometres. The field of view shown in this image is approximately 450 000 light-years across.
This image shows invisible near-infrared and mid-infrared wavelengths of light that have been translated into visible-light colours. The colour key shows which NIRCam and MIRI filters were used when collecting the light. The colour of each filter name is the visible light colour used to represent the infrared light that passes through that filter.
Credit: NASA, ESA, CSA, STScI

Press release from ESA Webb.