Webb explores Sagittarius B2, the largest star-forming cloud in the Milky Way
The NASA/ESA/CSA James Webb Space Telescope has revealed a colourful array of massive stars and glowing cosmic dust in the Sagittarius B2 (Sgr B2) molecular cloud, the most massive and active star-forming region in our Milky Way galaxy.
Stars, gas and cosmic dust in the Sagittarius B2 molecular cloud glow in near-infrared light, captured by Webb’s NIRCam (Near-Infrared Camera). In this light, astronomers see more of the region’s diverse, colourful stars, but less of its gas and dust structure. Webb’s instruments each provide astronomers with important information that help build a more complete picture of what is happening in this intriguing portion of the centre of our galaxy. Credit: NASA, ESA, CSA, STScI, A. Ginsburg (University of Florida), N. Budaiev (University of Florida), T. Yoo (University of Florida). Image processing: A. Pagan (STScI)
Sagittarius B2 is the Milky Way galaxy’s most massive and active star forming cloud, producing half of the stars created in the galactic centre region despite having only 10 percent of the area’s star-making material. Now, Webb has revealed stunning new views of the region, using both its near-infrared and mid-infrared instruments, to capture both its colourful stars and gaseous stellar nurseries in unprecedented detail.
Sagittarius B2 is located only a few hundred light-years from the supermassive black hole at the heart of the galaxy called Sagittarius A*, a region densely packed with stars, star-forming clouds, and complex magnetic fields. The infrared light that Webb detects is able to pass through some of the area’s thick clouds to reveal young stars and the warm dust surrounding them. Astronomers think that analysis of Webb’s data will help unravel enduring mysteries of the star formation process, and why Sagittarius B2 is forming so many more stars than the rest of the galactic centre.
However, one of the most notable aspects of Webb’s images of Sagittarius B2 are the portions that remain dark. These ironically empty-looking areas of space are actually so dense with gas and dust that even Webb cannot see through them. These thick clouds are the raw material of future stars and a cocoon for those still too young to shine.
Webb’s MIRI (Mid-Infrared Instrument) shows the Sagittarius B2 (Sgr B2) region in mid-infrared light, with warm dust glowing brightly. To the right is one clump of clouds that captured astronomers’ attention. It is redder than the rest of the clouds in the image and corresponds to an area that other telescopes have shown to be one of the most molecularly rich regions known. Additional analysis of this intriguing region could yield important insights into why Sgr B2 is so much more productive in making stars than the rest of the galactic centre. Only the brightest stars in this region emit mid-infrared light that can be picked up by Webb’s MIRI instrument, which is why this image has so many fewer stars than that captured by Webb’s NIRCam (Near-Infrared Camera). The darkest areas of the image are not empty space but areas where cosmic dust and gas are so dense that light cannot penetrate them to reach the telescope. Credit: NASA, ESA, CSA, STScI, A. Ginsburg (University of Florida), N. Budaiev (University of Florida), T. Yoo (University of Florida). Image processing: A. Pagan (STScI)
The high resolution and mid-infrared sensitivity of Webb’s MIRI (Mid-Infrared Instrument) revealed this region in unprecedented detail, including glowing cosmic dust heated by very young massive stars. The reddest area, known as Sagittarius B2 North, (note: north is to the right in these Webb images) is one of the most molecularly rich regions known, but astronomers have never seen it with such clarity.
This image of the Sagittarius B2 (Sgr B2) molecular cloud, captured by Webb’s MIRI (Mid-Infrared Instrument) includes compass arrows, scale bar, and colour key for reference. To create this image, mid-infrared wavelengths of light have been translated into visible-light colours. The colour key at the bottom shows which MIRI filters were used, and which visible-light colour was assigned to that filter. The north and east compass arrows show the orientation of the image on the sky. Note that the relationship between north and east on the sky (as seen from below) is flipped relative to direction arrows on a map of the ground (as seen from above). Credit: NASA, ESA, CSA, STScI, A. Ginsburg (University of Florida), N. Budaiev (University of Florida), T. Yoo (University of Florida). Image processing: A. Pagan (STScI)
The difference longer wavelengths of light make, even within the infrared spectrum, are stark when comparing the images from Webb’s MIRI and NIRCam (Near-Infrared Camera) instruments. Glowing gas and dust appear dramatically in mid-infrared light, while all but the brightest stars disappear from view.
In contrast to MIRI, colourful stars steal the show in Webb’s NIRCam image, punctuated occasionally by bright clouds of gas and dust. Further research into these stars will reveal details of their masses and ages, which will help astronomers better understand the process of star formation in this dense, active galactic centre region. Has it been going on for millions of years? Or has some unknown process triggered it only recently?
This image of the Sagittarius B2 (Sgr B2) molecular cloud, captured by Webb’s NIRCam (Near-Infrared Camera) instrument includes compass arrows, scale bar, and colour key for reference. To create this image, near-infrared wavelengths of light have been translated into visible-light colours. The colour key at the bottom shows which NIRCam filters were used, and which visible-light colour was assigned to that filter. The north and east compass arrows show the orientation of the image on the sky. Note that the relationship between north and east on the sky (as seen from below) is flipped relative to direction arrows on a map of the ground (as seen from above). Credit: NASA, ESA, CSA, STScI, A. Ginsburg (University of Florida), N. Budaiev (University of Florida), T. Yoo (University of Florida). Image processing: A. Pagan (STScI)
Astronomers hope Webb will shed light on why star formation in the galactic centre is so disproportionate. Though the region is stocked with plenty of gaseous raw material, on the whole it is not nearly as productive as Sagittarius B2. While Sagittarius B2 has only 10 percent of the galactic centre’s gas, it produces 50 percent of its stars.
Bibliographic information:
Nazar Budaiev, Adam Ginsburg, Ashley T. Barnes, Desmond Jeff, Taehwa Yoo, Cara Battersby, Alyssa Bulatek, Xing Lu, Elisabeth A.C. Mills, Daniel L. Walker, JWST’s first view of the most vigorously star-forming cloud in the Galactic center — Sagittarius B2, DOI: https://doi.org/10.48550/arXiv.2509.11771
Webb observes Sharpless 2-284, a Herbig-Haro object, an immense stellar jet on outskirts of our Milky Way
Way out toward the edge of our Milky Way galaxy, a young star that is still forming is sending out a birth announcement to the Universe in the form of a celebratory looking firework. These seething twin jets of hot gasses are blazing across 8 light-years – twice the distance between our Sun and the nearest star system. Superheated gases falling onto the massive star are blasted back into space along the star’s rotational axis and powerful magnetic fields confine the jets to narrow beams. The NASA/ESA/CSA James Webb Space Telescope witnessed the spectacle in infrared light. The jets are plowing into interstellar dust and gas, creating fascinating details captured only by Webb.
The NASA/ESA/CSA James Webb Space Telescope recently imaged an extremely large stellar jet at the outskirts of our Milky Way galaxy in the proto-cluster Sh2-284. This Herbig-Haro (HH) object, jets of plasma shooting out from newly formed stars, is 8 light-years across. This is about double the distance from our Sun to its closest neighboring star system, Alpha Centauri. Its detection provides evidence that HH jets scale with the mass of their parent stars—the more massive the stellar engine driving the plasma, the larger the resulting jet. Credit: NASA, ESA, CSA, STScI, Y. Cheng (NAOJ), J. DePasquale (STScI)
A blowtorch of seething gasses erupting from a volcanically growing monster star has been captured by Webb. Stretching across 8 light-years, the length of the stellar eruption is approximately twice the distance between our Sun and the nearby Alpha Centauri system. The size and strength of this particular stellar jet, known as Sharpless 2-284 (Sh2-284 for short), qualifies it as rare, say researchers.
The outflow is streaking across space at hundreds of thousands of kilometres per hour. The central protostar, weighing as much as ten of our Suns, is located 15,000 light-years away in the outer reaches of our galaxy.
The Webb discovery was serendipitous. “We didn’t really know there was a massive star with this kind of super-jet out there before the observation. Such a spectacular outflow of molecular hydrogen from a massive star is rare in other regions of our galaxy,” said lead author Yu Cheng of the National Astronomical Observatory of Japan.
This unique class of stellar fireworks, called Herbig-Haro (HH) objects, are highly collimated jets of plasma shooting out from newly forming stars. Such jetted outflows are a star’s spectacular “birth announcement” to the Universe. Some of the infalling gas building up around the central star is blasted along the star’s spin axis, likely under the influence of magnetic fields.
Today, well over 300 HH objects have been observed, but mainly from low-mass stars. These spindle-like jets offer clues into the nature of newly forming stars. The energetics, narrowness, and evolutionary time scales of HH objects all serve to constrain models of the environment and physical properties of the young stellar object powering the outflow.
“I was really surprised at the order, symmetry, and size of the jet when we first looked at it,” said co-author Jonathan Tan of the University of Virginia in Charlottesville and Chalmers University of Technology in Gothenburg, Sweden.
Its detection offers evidence that HH jets must scale up with the mass of the star powering them. The more massive the stellar engine propelling the plasma, the larger the gusher’s size.
The jet’s detailed filamentary structure, captured by Webb’s crisp resolution in infrared light, is evidence the jet is plowing into interstellar dust and gas. This creates separate knots, bow shocks, and linear chains.
The tips of the jet, lying in opposite directions, encapsulate the history of the star’s formation. “Originally the material was close into the star, but over 100,000 years the tips were propagating out, and then the stuff behind is a younger outflow,” said Tan.
Outlier
At nearly twice the distance from the galactic center as our Sun, the host proto-cluster that’s home to the voracious jet is on the periphery of our Milky Way galaxy.
Within the cluster, a few hundred stars are still forming. Being in the galactic hinterlands means the stars are deficient in heavier elements beyond hydrogen and helium. This is measured as metallicity, which gradually increases over cosmic time as each passing stellar generation expels end products of nuclear fusion through winds and supernovae. The low metallicity of Sh2-284 is a reflection of its relatively pristine nature, making it a local analog for the environments in the early universe that were also deficient in heavier elements.
“Webb’s exquisite data have also shown us that relatively more stars seem to form at lower masses in Sh2-284 than in closer, more metal-rich clusters,” said co-author Morten Andersen, of the European Southern Observatory, and lead author of a second paper on the Webb data. “This cluster is an excellent region to help us understand star formation throughout the Universe.”
“Massive stars, like the one found inside this cluster, have very important influences on the evolution of galaxies. Our discovery is shedding light on the formation mechanism of massive stars in low metallicity environments, so we can use this massive star as a laboratory to study what was going on in earlier cosmic history,” added Cheng.
Unrolling stellar tapestry
Stellar jets, which are powered by the gravitational energy released as a star grows in mass, encode the formation history of the protostar.
“Webb’s new images are telling us that the formation of massive stars in such environments could proceed via a relatively stable disc around the star that is expected in theoretical models of star formation known as core accretion,” said Tan. “Once we found a massive star launching these jets, we realised we could use the Webb observations to test theories of massive star formation. We developed new theoretical core accretion models that were fit to the data, to basically tell us what kind of star is in the center. These models imply that the star is about 10 times the mass of the Sun and is still growing and has been powering this outflow.”
For more than 30 years, astronomers have disagreed about how massive stars form. Some think a massive star requires a very chaotic process, called competitive accretion.
In the competitive accretion model, material falls in from many different directions so that the orientation of the disc changes over time. The outflow is launched perpendicularly, above and below the disc, and so would also appear to twist and turn in different directions.
“However, what we’ve seen here, because we’ve got the whole history – a tapestry of the story – is that the opposite sides of the jets are nearly 180 degrees apart from each other. That tells us that this central disc is held steady and validates a prediction of the core accretion theory,” said Tan.
Where there’s one massive star, there could be others in this outer frontier of the Milky Way. Other massive stars may not yet have reached the point of firing off Roman-candle-style outflows. Data from the Atacama Large Millimeter Array in Chile, also presented in this study, has found another dense stellar core that could be in an earlier stage of construction.
This image of the stellar jet in Sh2-284, captured by the NASA/ESA/CSA James Webb Space Telescope’s NIRCam (Near-Infrared Camera), shows compass arrows, scale bar, and color key for reference. The north and east compass arrows show the orientation of the image on the sky. Note that the relationship between north and east on the sky (as seen from below) is flipped to the direction arrows on a map of the ground (as seen from above). The scale bar is labeled in light-years, which is the distance that light travels in one Earth-year, and arcsec (It takes 1.1 years for light to travel a distance equal to the length of the scale bar.) One light-year is equal to about 5.88 trillion miles or 9.46 trillion kilometers. This image shows invisible near-infrared wavelengths of light that have been translated into visible-light colors. The color key shows which NIRCam filters were used when collecting the light. The color of each filter name is the visible light color used to represent the infrared light that passes through that filter. Credit: NASA, ESA, CSA, STScI, Y. Cheng (NAOJ), J. DePasquale (STScI)
A mystery interstellar object discovered last week is likely to be the oldest comet ever seen – possibly predating our solar system by more than three billion years, researchers say.
The “water ice-rich” visitor, named 3I/ATLAS, is only the third known object from beyond our solar system ever spotted in our cosmic neighbourhood and the first to reach us from a completely different region of our Milky Way galaxy.
Top view of the Milky Way galaxy showing the estimated orbits of both our Sun and the 3I/ATLAS comet. 3I/ATLAS is shown in red dashed lines, and the Sun is shown in yellow dotted lines. The large extent of 3I’s orbit into the outer thick disk is clear, while the Sun stays nearer the core of the galaxy.
M. Hopkins/Ōtautahi-Oxford team. Base map: ESA/Gaia/DPAC, Stefan Payne-Wardenaar, CC-BY-SA 4.0
The same as Figure 1 with text labels showing the various arms of the galaxy, and the current meeting of our solar system and 3I/ATLAS in the Orion Arm towards the bottom.
M. Hopkins/Ōtautahi-Oxford team. Base map: ESA/Gaia/DPAC, Stefan Payne-Wardenaar, CC-BY-SA 4.0
A zoomed-in version of Figure 1, the unlabelled orbits.
M. Hopkins/Ōtautahi-Oxford team. Base map: ESA/Gaia/DPAC, Stefan Payne-Wardenaar, CC-BY-SA 4.0
A zoomed-in version of Figure 3, with text labels.
M. Hopkins/Ōtautahi-Oxford team. Base map: ESA/Gaia/DPAC, Stefan Payne-Wardenaar, CC-BY-SA 4.0
Unlike the previous two objects to enter our solar system from elsewhere in the cosmos, 3I/ATLAS appears to be travelling on a steep path through the galaxy, with a trajectory that suggests it originated from the Milky Way’s ‘thick disk’ – a population of ancient stars orbiting above and below the thin plane where the Sun and most stars reside.
“All non-interstellar comets such as Halley’s comet formed with our solar system, so are up to 4.5 billion years old,” Hopkins said.
“But interstellar visitors have the potential to be far older, and of those known about so far our statistical method suggests that 3I/ATLAS is very likely to be the oldest comet we have ever seen.”
The object was first spotted on 1 July 2025 by the ATLAS survey telescope in Chile, when it was about 670 million km from the Sun.
Hopkins’ research predicts that, because 3I/ATLAS likely formed around an old, thick-disk star, it should be rich in water ice.
“This is an object from a part of the galaxy we’ve never seen up close before,” said Professor Chris Lintott, co-author of the study and presenter of the BBC’s The Sky at Night.
“We think there’s a two-thirds chance this comet is older than the solar system, and that it’s been drifting through interstellar space ever since.”
As it approaches the Sun, sunlight will heat 3I/ATLAS’s surface and trigger cometary activity, or the outgassing of vapour and dust that creates a glowing coma and tail.
Early observations already suggest the comet is active, and possibly larger than either of its interstellar predecessors, 1I/’Oumuamua (spotted in 2017) and 2I/Borisov (2019).
If confirmed, this could have implications for how many similar objects future telescopes, such as the new Vera C. Rubin Observatory, are likely to detect. It may also provide clues about the role that ancient interstellar comets play in seeding star and planet formation across the galaxy.
“We’re in an exciting time: 3I is already showing signs of activity. The gases that may be seen in the future as 3I is heated by the Sun will test our model,” said co-author Dr Michele Bannister, of the University of Canterbury in New Zealand.
“Some of the biggest telescopes in the world are already observing this new interstellar object – one of them may be able to find out!”
The discovery of 3I caught the team by the surprise. It happened as they were gearing up for the beginning of survey operations with the Vera C. Rubin Observatory, which their model predicts will discover between 5 and 50 interstellar objects.
“The solar system science community was already excited about the potential discoveries Rubin will make in the next 10 years, including an unprecedented number of interstellar objects,” said co-researcher Dr Rosemary Dorsey, of the University of Helsinki.
“The discovery of 3I suggests that prospects for Rubin may now be more optimistic; we may find about 50 objects, of which some would be similar in size to 3I. This week’s news, especially just after the Rubin First Look images, makes the upcoming start of observations all the more exciting.”
The team’s findings come from applying a model developed during Hopkins’ doctoral research, which simulates the properties of interstellar objects based on their orbits and likely stellar origins.
A side-on view of the Milky Way, showing the estimated orbits of both our Sun and the 3I/ATLAS comet. 3I/ATLAS is shown in red dashed lines, and the Sun is shown in yellow dotted lines. The large extent of 3I’s orbit vertically into the outer thick disk is clear, while the Sun stays nearer the plane of the galaxy.
M. Hopkins/Ōtautahi-Oxford team. Base map: ESA/Gaia/DPAC, Stefan Payne-Wardenaar, CC-BY-SA 4.0
A zoomed-in version of Figure 5.
M. Hopkins/Ōtautahi-Oxford team. Base map: ESA/Gaia/DPAC, Stefan Payne-Wardenaar, CC-BY-SA 4.0
Just a week before the comet’s discovery, Hopkins had defended his thesis, and when 3I/ATLAS was announced, he was set to go on holiday. Instead, he found himself comparing real-time data to his predictions.
“Rather than the quiet Wednesday I had planned, I woke up to messages like ‘3I!!!!!!!!!!’,” said Hopkins. “It’s a fantastic opportunity to test our model on something brand new and possibly ancient.”
The researchers’ model, dubbed the Ōtautahi–Oxford Model, marks the first real-time application of predictive modelling to an interstellar comet.
For those keen to catch a glimpse of 3I/ATLAS, it should be visible through a reasonably-sized amateur telescope in late 2025 and early 2026.
Hubble and a new study published in Nature Astronomy cast doubt on the certainty of a collision between the Milky Way and the Andromeda galaxy
Over a decade’s worth of NASA/ESA Hubble Space Telescope data was used to re-examine the long-held prediction that the Milky Way galaxy will collide with the Andromeda galaxy in about 4.5 billion years. The astronomers found that, based on the latest observational data from Hubble as well as the Gaia space telescope, there is only a 50-50 chance of the two galaxies colliding within the next 10 billion years. The study also found that the presence of the Large Magellanic Cloud can affect the trajectory of the Milky Way and make the collision less likely. The researchers emphasize that predicting the long-term future of galaxy interactions is highly uncertain, but the new findings challenge the previous consensus and suggest the fate of the Milky Way remains an open question.
Hubble and a new study published in Nature Astronomy cast doubt on the certainty of a collision between the Milky Way and the Andromeda galaxy. This selection of images of external galaxies illustrates three encounter scenarios between our Milky Way and the neighboring Andromeda galaxy. In the top left panel, a wide-field DSS image showing galaxies M81 and M82 serves as an example of the Milky Way and Andromeda passing each other at large distances. The top right panel shows NGC 6786, a pair of interacting galaxies displaying the telltale signs of tidal disturbances after a close encounter. The bottom panel shows NGC 520, a cosmic train wreck as two galaxies are actively merging together. Credit: NASA, ESA, STScI, Till Sawala (University of Helsinki), DSS, J. DePasquale (STScI)
As far back as 1912, astronomers realized that the Andromeda galaxy — then thought to be only a nebula — was headed our way. A century later, astronomers using the NASA/ESA Hubble Space Telescope were able to measure the sideways motion of Andromeda and found it was so negligible that an eventual head-on collision with the Milky Way seemed almost certain.
A smashup between our own galaxy and Andromeda would trigger a firestorm of star birth, supernovae, and maybe toss our Sun into a different orbit. Simulations had suggested it was inevitable.
However, a new study using data from Hubble and ESA’s Gaia suggests this may not necessarily be the case. Researchers combining observations from the two space observatories re-examined the long-held prediction of a Milky Way – Andromeda collision, and found it is far less inevitable than astronomers had previously suspected.
“We have the most comprehensive study of this problem today that actually folds in all the observational uncertainties,” said Till Sawala, astronomer at the University of Helsinki in Finland and lead author of the study, which appears today in the journal Nature Astronomy.
His team includes researchers at Durham University, United Kingdom; the University of Toulouse, France; and the University of Western Australia. They found that there is approximately a 50-50 chance of the two galaxies colliding within the next 10 billion years. They based this conclusion on computer simulations using the latest observational data.
Sawala emphasized that predicting the long-term future of galaxy interactions is highly uncertain, but the new findings challenge the previous consensus and suggest the fate of the Milky Way remains an open question.
“Even using the latest and most precise observational data available, the future of the Local Group of several dozen galaxies is uncertain. Intriguingly, we find an almost equal probability for the widely publicized merger scenario, or, conversely, an alternative one where the Milky Way and Andromeda survive unscathed,” said Sawala.
The collision of the two galaxies had seemed much more likely in 2012, when astronomers Roeland van der Marel and Tony Sohn of the Space Telescope Science Institute in Baltimore, Maryland published a detailed analysis of Hubble observations over a five-to-seven-year period, indicating a direct impact in no more than 5 billion years.
“It’s somewhat ironic that, despite the addition of more precise Hubble data taken in recent years, we are now less certain about the outcome of a potential collision. That’s because of the more complex analysis and because we consider a more complete system. But the only way to get to a new prediction about the eventual fate of the Milky Way will be with even better data,” said Sawala.
Astronomers considered 22 different variables that could affect the potential collision between our galaxy and our neighbor, and ran 100,000 simulations called Monte Carlo simulations stretching to 10 billion years into the future.
“Because there are so many variables that each have their errors, that accumulates to rather large uncertainty about the outcome, leading to the conclusion that the chance of a direct collision is only 50% within the next 10 billion years,” said Sawala.
“The Milky Way and Andromeda alone would remain in the same plane as they orbit each other, but this doesn’t mean they need to crash. They could still go past each other,” said Sawala.
Researchers also considered the effects of the orbits of Andromeda’s large satellite galaxy, M33, and a satellite galaxy of the Milky Way called the Large Magellanic Cloud (LMC).
“The extra mass of Andromeda’s satellite galaxy M33 pulls the Milky Way a little bit more towards it. However, we also show that the LMC pulls the Milky Way off the orbital plane and away from Andromeda. It doesn’t mean that the LMC will save us from that merger, but it makes it a bit less likely,” said Sawala.
In about half of the simulations, the two main galaxies fly past each other separated by around half a million light-years or less (five times the Milky Way’s diameter). They move outward but then come back and eventually merge in the far future. The gradual decay of the orbit is caused by a process called dynamical friction between the vast dark-matter halos that surround each galaxy at the beginning.
In most of the other cases, the galaxies don’t even come close enough for dynamical friction to work effectively. In this case, the two galaxies can continue their orbital waltz for a very long time.
The new result also still leaves a small chance of around 2% for a head-on collision between the galaxies in only 4 to 5 billion years. Considering that the warming Sun makes Earth uninhabitable in roughly 1 billion years, and the Sun itself will likely burn out in 5 billion years, a collision with Andromeda is the least of our cosmic worries.
Hubble investigates SGR 0501+4516 and the magnetar’s birthplace
Magnetars are ultra-dense stellar remnants with extremely strong magnetic fields. Researchers using the NASA/ESA Hubble Space Telescope have discovered that the magnetar SGR 0501+4516 was not born in a neighbouring supernova as previously thought. The birthplace of this object is now unknown, and SGR 0501+4516 is the likeliest candidate in our galaxy for a magnetar that was not born in a supernova. This discovery was made possible by Hubble’s sensitive instruments as well as precise benchmarks from ESA’s Gaia spacecraft.
In 2008, NASA’s Swift Observatory spotted brief, intense flashes of gamma rays from the outskirts of the Milky Way. The source, an object named SGR 0501+4516, is one of only about 30 known magnetars in the Milky Way.
A magnetar is a special type of neutron star. Neutron stars are some of the most extreme objects in the Universe. These stars typically pack more than the mass of the Sun into a sphere of neutrons about 20 kilometres across. Unsurprisingly, these exotic objects can display several extreme behaviours, such as X-ray and gamma-ray outbursts, intense magnetic fields and rapid rotation.
“Magnetars are neutron stars — the dead remnants of stars, composed entirely of neutrons. They’re so heavy and dense that the electrons and protons which make up atoms have been crushed together into neutrons. What makes magnetars unique is their extreme magnetic fields, billions of times stronger than the strongest magnets we have on Earth,”
said Ashley Chrimes, lead author of the discovery paper published today in the journal Astronomy & Astrophysics. Chrimes is a European Space Agency Research Fellow at the European Space Research and Technology Centre (ESTEC) in the Netherlands.
Most neutron stars are thought to be born in core-collapse supernovae. These spectacular cosmic explosions happen when stars far more massive than the Sun run out of fuel for nuclear fusion. The star’s outer layers fall inward and rebound off the collapsed core in an explosion that can briefly outshine an entire galaxy.
Because magnetars are themselves neutron stars, the natural explanation for their formation is that they too are born in supernovae. This appeared to be the case for SGR 0501+4516, which is located promisingly close to a supernova remnant called HB9. The separation between the magnetar and the center of the supernova remnant on the sky is just 80 arcminutes, or slightly wider than your pinky finger when viewed at the end of your outstretched arm.
But a decade-long study with Hubble cast doubt on the magnetar’s birthplace. After initial observations with ground-based telescopes shortly after SGR 0501+4516’s discovery, researchers leveraged Hubble’s exquisite sensitivity and steady pointing to spot the magnetar’s faint infrared glow in 2010, 2012 and 2020. Each of these images was aligned to a reference frame defined by observations from the European Space Agency’s Gaia spacecraft, which has crafted an extraordinarily precise three-dimensional map of nearly two billion stars in the Milky Way. This method revealed the subtle motion of the magnetar as it inched across the sky. This work therefore demonstrates that Hubble and ESA’s Gaia can reveal mysteries never seen before when joining forces.
“All of this movement we measure is smaller than a single pixel of a Hubble image,” said co-investigator Joe Lyman of the University of Warwick, United Kingdom. “Being able to robustly perform such measurements really is a testament to the long-term stability of Hubble.”
By tracking the magnetar’s position, the team was able to measure the object’s apparent motion across the sky. Both the speed and direction of SGR 0501+4516’s movement showed that the magnetar could not be associated with the nearby supernova remnant. Tracing the magnetar’s trajectory thousands of years into the past showed that there were no other supernova remnants or massive star clusters that it could be associated with.
If SGR 0501+4516 was not born in supernova remnant HB9, the magnetar must either be far older than its reported 20 000-year age, or it must have formed in another way. Magnetars may also be able to form through the merger of two lower-mass neutron stars or through a process called accretion-induced collapse. Accretion-induced collapse requires a binary star system containing a white dwarf: the crystallised core of a dead Sun-like star. If the white dwarf ensnares gas from its companion, it can grow too massive to support itself, leading to an explosion — or possibly the creation of a magnetar.
“Normally, this scenario leads to the ignition of nuclear reactions, and the white dwarf exploding, leaving nothing behind. But it has been theorised that under certain conditions, the white dwarf can instead collapse into a neutron star. We think this might be how SGR 0501 was born,” added Andrew Levan of Radboud University in the Netherlands and the University of Warwick in the United Kingdom.
SGR 0501+4516 is currently the best candidate for a magnetar in our galaxy that may have formed through a merger or accretion-induced collapse. Magnetars that form through accretion-induced collapse could provide an explanation for some of the mysterious cosmic signals called fast radio bursts, which are brief but powerful flashes of radio waves. In particular, this scenario may explain the origin of fast radio bursts that emerge from stellar populations too ancient to have recently birthed stars massive enough to explode as supernovae.
“Magnetar birth rates and formation scenarios are among the most pressing questions in high-energy astrophysics, with implications for many of the Universe’s most powerful transient events, such as gamma-ray bursts, superluminous supernovae, and fast radio bursts,” said Nanda Rea of the Institute of Space Sciences in Barcelona, Spain.
The research team has further Hubble observations planned to study the origins of other magnetars in the Milky Way, helping to understand how these extreme objects form.
This is an artist’s impression of a magnetar, which is a special type of neutron star. Neutron stars are some of the most extreme objects in the Universe. These stars typically pack more than the mass of the Sun into a sphere of neutrons about 20 kilometres across. Unsurprisingly, these exotic objects can display several extreme behaviours, such as X-ray and gamma-ray outbursts, intense magnetic fields and rapid rotation. Magnetars are a specific type of neutron star that are distinguished by their exceptionally strong magnetic fields (which are significantly stronger than those of typical neutron stars). Researchers using the NASA/ESA Hubble Space Telescope have discovered that the magnetar SGR 0501+4516 was not born in a neighbouring supernova as previously thought. The birthplace of this object is now unknown, and SGR 0501+4516 is the likeliest candidate in our galaxy for a magnetar that was not born in a supernova. It is one of only about 30 known magnetars in the Milky Way. Credit: ESA
Bibliographic information:
The infrared counterpart and proper motion of magnetar SGR 0501+4516, Astronomy & Astrophysics Volume 696, April 2025 A127, DOI: https://doi.org/10.1051/0004-6361/202453479
Webb exposes complex atmosphere of SIMP 0136, a starless super-Jupiter
An international team of researchers has discovered that previously observed variations in brightness across a free-floating planetary-mass object known as SIMP 0136 must be the result of a complex combination of atmospheric factors, and cannot be explained by clouds alone.
Using the NASA/ESA/CSA James Webb Space Telescope to monitor a broad spectrum of infrared light emitted by SIMP 0136 over two full rotation periods, the team was able to detect variations in cloud layers, temperature, and carbon chemistry that were previously hidden from view. The results provide crucial insight into the three-dimensional complexity of gas giant atmospheres within and beyond our solar system.
Rapidly rotating, free-floating
SIMP 0136 is a rapidly rotating, free-floating object roughly 13 times the mass of Jupiter, located in the Milky Way just 20 light-years from Earth. Although it is not classified as a gas giant exoplanet — it doesn’t orbit a star and may instead be a brown dwarf — SIMP 0136 is an ideal target for exo-meteorology: It is the brightest object of its kind in the northern sky. Because it is isolated, it can be observed directly and with no fear of light contamination or variability caused by a host star. And its short rotation period of just 2.4 hours makes it possible to survey very efficiently.
Prior to the Webb observations, SIMP 0136 had been studied extensively using ground-based observatories, as well as and NASA’s Spitzer Space Telescope and the NASA/ESA Hubble Space Telescope.
“We already knew that it varies in brightness, and we were confident that there are patchy cloud layers that rotate in and out of view and evolve over time,” explained Allison McCarthy, doctoral student at Boston University and lead author on a study published today in The Astrophysical Journal Letters. “We also thought there could be temperature variations, chemical reactions, and possibly some effects of auroral activity affecting the brightness, but we weren’t sure.”
To figure it out, the team needed Webb’s ability to measure very precise changes in brightness over a broad range of wavelengths.
Charting thousands of infrared rainbows
Using NIRSpec (Near-Infrared Spectrograph), Webb captured thousands of individual 0.6- to 5.3-micron spectra — one every 1.8 seconds over more than three hours as the object completed one full rotation. This was immediately followed by an observation with MIRI (Mid-Infrared Instrument), which collected hundreds of measurements of 5- to 14-micron light — one every 19.2 seconds, over another rotation.
The result was hundreds of detailed light curves, each showing the change in brightness of a very precise wavelength (color) as different sides of the object rotated into view.
“To see the full spectrum of this object change over the course of minutes was incredible,” said principal investigator Johanna Vos, from Trinity College Dublin. “Until now, we only had a little slice of the near-infrared spectrum from Hubble, and a few brightness measurements from Spitzer.”
The team noticed almost immediately that there were several distinct light-curve shapes. At any given time, some wavelengths were growing brighter, while others were becoming dimmer or not changing much at all. A number of different factors must be affecting the brightness variations.
“Imagine watching Earth from far away. If you were to look at each color separately, you would see different patterns that tell you something about its surface and atmosphere, even if you couldn’t make out the individual features,” explained co-author Philip Muirhead, also from Boston University. “Blue would increase as oceans rotate into view. Changes in brown and green would tell you something about soil and vegetation.”
This artist’s concept shows what the isolated planetary-mass object SIMP 0136 could look like based on recent observations from the NASA/ESA/CSA James Webb Space Telescope. SIMP 0136 has a mass about 13 times that of Jupiter. Although it is thought to have the structure and composition of a gas giant, it is not technically classified as an exoplanet because it doesn’t orbit its own star. The colors shown in the illustration represent near-infrared light, which is invisible to human eyes. SIMP 0136 is relatively warm — about 825 degrees Celsius or 1,100 kelvins — but is not hot enough to give off enough visible light to see from Earth, and is not illuminated by a host star. The bluish glow near the poles represents auroral energy (light given off by electrons spiraling in a magnetic field) which has been detected at radio wavelengths. Researchers used NIRSpec (Near-infrared Spectrograph) and MIRI (Mid-Infrared Instrument) to monitor the brightness of SIMP 0136 over two full rotations in July 2023. By analyzing the change in brightness of different wavelengths over time, researchers were able to detect variability in cloud cover at different depths, temperature variations in the high atmosphere, and changes in carbon chemistry as different sides of the object rotated in and out of view. SIMP 0136 is located within the Milky Way, about 20 light-years from Earth, in the constellation Pisces. It is the brightest isolated planet or brown dwarf visible from the Northern Hemisphere, and is thought to be about 200 million years old. This illustration is based on spectroscopic observations. Webb has not captured a direct image of the object. Credit: NASA, ESA, CSA, J. Olmsted (STScI)
Patchy clouds, hot spots, and carbon chemistry
To figure out what could be causing the variability on SIMP 0136, the team used atmospheric models to show where in the atmosphere each wavelength of light was originating.
“Different wavelengths provide information about different depths in the atmosphere,” explained McCarthy. “We started to realize that the wavelengths that had the most similar light-curve shapes also probed the same depths, which reinforced this idea that they must be caused by the same mechanism.”
One group of wavelengths, for example, originates deep in the atmosphere where there could be patchy clouds made of iron particles. A second group comes from higher clouds thought to be made of tiny grains of silicate minerals. The variations in both of these light curves are related to patchiness of the cloud layers.
A third group of wavelengths originates at very high altitude, far above the clouds, and seems to track temperature. Bright “hot spots” could be related to auroras that were previously detected at radio wavelengths, or to upwelling of hot gas from deeper in the atmosphere.
Some of the light curves cannot be explained by either clouds or temperature, but instead show variations related to atmospheric carbon chemistry. There could be pockets of carbon monoxide and carbon dioxide rotating in and out of view, or chemical reactions causing the atmosphere to change.
“We haven’t really figured out the chemistry part of the puzzle yet,” said Vos. “But these results are really exciting because they are showing us that the abundances of molecules like methane and carbon dioxide could change from place to place and over time. If we are looking at an exoplanet and can get only one measurement, we need to consider that it might not be representative of the entire planet.”
This research was conducted as part of Webb’s General Observer (GO) Program 3548.
These light curves show the change in brightness of three different sets of wavelengths (colors) of near-infrared light coming from the isolated planetary-mass object SIMP 0136 as it rotated. The light was captured by Webb’s NIRSpec (Near-Infrared Spectrograph), which collected a total of 5,726 spectra — one every 1.8 seconds — over the course of about 3 hours on 23 July 2023 (SIMP 0136 completes one rotation every 2.4 hours). By comparing these light curves to models, researchers were able to show that each set of wavelengths probes different depths (pressures) in the atmosphere. The curve shown in red tracks the brightness of 0.9- to 1.4-micron light thought to originate deep in the atmosphere at a pressure of about 10 bars (about 10 times the air pressure at sea level on Earth), within clouds made of iron particles. The curve shown in yellow tracks the brightness of 1.4- to 2.3-micron light from a pressure of about 1 bar within higher clouds made of tiny grains of silicate minerals. The variations in brightness shown by these two curves is related to patchiness of the cloud layers, which emit some wavelengths of light and absorb others. The curve shown in blue tracks the brightness of 3.3- to 3.6-micron light that originates high above the clouds at a pressure of about 0.1 bars. Changes in brightness of these wavelengths are related to variations in temperature around the object. Bright “hot spots” could be related to auroras that have been detected at radio wavelengths, or to upwelling of hot gas from deeper in the atmosphere. The differences in shape of these three light curves show that there are complex variations in SIMP 0136’s atmosphere with depth as well as longitude. If the atmosphere varied around the object in the same way at all depths, the light curves would have similar patterns. If it varied with depth, but not longitude, the light curves would be straight, flat lines. Note this graph shows the relative change in brightness for each given set of wavelengths over time, not the difference in absolute brightness between the different sets. At any given time, there is more light coming from the deep atmosphere (red light curve) than from the upper atmosphere (blue light curve). SIMP 0136 is located within the Milky Way, about 20 light-years from Earth, in the constellation Pisces. It is the brightest isolated planet or brown dwarf visible from the Northern Hemisphere, and is thought to be about 200 million years old. The artist’s concepts are based on spectroscopic observations. Webb has not captured a direct image of the object. Credit: NASA, ESA, CSA, J. Olmsted (STScI)
Hubble traces hidden history of the Andromeda Galaxy
Panorama of nearest galaxy unveils hundreds of millions of stars
The largest photomosaic of the Andromeda galaxy, assembled from NASA/ESA Hubble Space Telescope observations, has been unveiled. It took more than 10 years to collect data for this colorful portrait of our neighboring galaxy and was created from more than 600 snapshots. This stunning, colorful mosaic captures the glow of 200 million stars, and is spread across roughly 2.5 billion pixels.
In the years following the launch of the NASA/ESA Hubble Space Telescope, astronomers have tallied over 1 trillion galaxies in the universe. But only one galaxy stands out as the most important nearby stellar island to our Milky Way: the magnificent Andromeda galaxy (Messier 31). It can be seen with the naked eye on a very clear autumn night as a faint cigar-shaped object roughly the apparent angular diameter of our Moon.
A century ago, Edwin Hubble first established that this so-called “spiral nebula” was actually far outside our own Milky Way galaxy — at a distance of approximately 2.5 million light-years, or roughly 25 Milky Way diameters. Prior to that, astronomers had long thought that the Milky Way encompassed the entire universe. Overnight, Hubble’s discovery turned cosmology upside down by unveiling an infinitely grander universe.
Now, a century later, the space telescope named for Hubble has accomplished the most comprehensive survey of this enticing empire of stars. The Hubble telescope is yielding new clues to the evolutionary history of Andromeda, and it looks markedly different from the Milky Way’s history.
Without Andromeda as a proxy for spiral galaxies in the universe at large, astronomers would know much less about the structure and evolution of our own Milky Way. That’s because we are embedded inside the Milky Way.
Hubble’s sharp imaging capabilities can resolve more than 200 million stars in the Andromeda galaxy, detecting only stars brighter than our Sun. They look like grains of sand across the beach. But that’s just the tip of the iceberg. Andromeda’s total population is estimated to be 1 trillion stars, with many less massive stars falling below Hubble’s sensitivity limit.
Photographing Andromeda was a herculean task because the galaxy is a much bigger target on the sky than the galaxies Hubble routinely observes, which are often billions of light-years away. The full mosaic was carried out under two Hubble observing programs. In total it required over 1,000 Hubble orbits, spanning more than a decade.
This is the largest photomosaic ever made by the Hubble Space Telescope. The target is the vast Andromeda galaxy that is only 2.5 million light-years from Earth, making it the nearest galaxy to our own Milky Way. Andromeda is seen almost edge-on, tilted by 77 degrees relative to Earth’s view. The galaxy is so large that the mosaic is assembled from approximately 600 separate fields of view taken over 10 years of Hubble observing. The mosaic image is made up of at least 2.5 billion pixels. Hubble resolves an estimated 200 million stars that are hotter than our sun, but still a fraction of the galaxy’s total estimated stellar population. Interesting regions include: Clusters of bright blue stars embedded within the galaxy, background galaxies seen much farther away, and photo-bombing by a couple bright foreground stars that are actually inside our Milky Way; NGC 206 the most conspicuous star cloud in Andromeda; A young cluster of blue newborn stars; The satellite galaxy M32, that may be the residual core of a galaxy that once collided with Andromeda; Dark dust lanes across myriad stars. Credit: NASA, ESA, B. Williams (U. of Washington)
This panorama started with the Panchromatic Hubble Andromeda Treasury (PHAT) program about a decade ago. Images were obtained at near-ultraviolet, visible, and near-infrared wavelengths using the Advanced Camera for Surveys and the Wide Field Camera aboard Hubble to photograph the northern half of Andromeda.
This program was followed up by the Panchromatic Hubble Andromeda Southern Treasury (PHAST), which added images of approximately 100 million stars in the southern half of Andromeda. This region is structurally unique and more sensitive to the galaxy’s merger history than the northern disk mapped by the PHAT survey.
The combined programs collectively cover the entire disk of Andromeda, which is seen almost edge-on — tilted by 77 degrees relative to Earth’s view. The galaxy is so large that the mosaic is assembled from approximately 600 separate fields of view. The mosaic image is made up of at least 2.5 billion pixels.
The complementary Hubble survey programs provide information about the age, heavy-element abundance and stellar masses inside Andromeda. This will allow astronomers to distinguish between competing scenarios where Andromeda merged with one or more galaxies. Hubble’s detailed measurements constrain models of Andromeda’s merger history and disk evolution.
Though the Milky Way and Andromeda formed presumably around the same time many billions of years ago, observational evidence shows that they have very different evolutionary histories, despite growing up in the same cosmological neighborhood. Andromeda seems to be more highly populated with younger stars and unusual features like coherent streams of stars, say researchers. This implies it has a more active recent star-formation and interaction history than the Milky Way.
A possible culprit is the compact satellite galaxy Messier 32, which resembles the stripped-down core of a once-spiral galaxy that may have interacted with Andromeda in the past. Computer simulations suggest that when a close encounter with another galaxy uses up all the available interstellar gas, star formation subsides.
Hubble’s new findings will support future observations by the NASA/ESA/CSA James Webb Space Telescope.
This the largest photomosaic ever assembled from NASA/ESA Hubble Space Telescope observations: it is a panoramic view of the neighboring Andromeda galaxy, located 2.5 million light-years away. It took over 10 years to make this vast and colorful portrait of the galaxy, requiring over 600 Hubble snapshots. The galaxy is so close to us, that in angular size it is six times the apparent diameter of the full Moon, and can be seen with the unaided eye. For Hubble’s pinpoint view, that’s a lot of celestial real estate to cover. This stunning, colorful mosaic captures the glow of 200 million stars. That’s still a fraction of Andromeda’s population. And the stars are spread across about 2.5 billion pixels. The detailed look at the resolved stars will help astronomers piece together the galaxy’s past history that includes mergers with smaller satellite galaxies. Credit: NASA, ESA, B. Williams (University of Washington)
Webb watches Wolf-Rayet 140: carbon-rich dust shells form, expand in star system
Astronomers using the NASA/ESA/CSA James Webb Space Telescope have identified two stars responsible for generating carbon-rich dust a mere 5000 light-years away in our own Milky Way galaxy. As the massive stars in Wolf-Rayet 140 swing past one another on their elongated orbits, their winds collide and produce the carbon-rich dust. For a few months every eight years, the stars form a new shell of dust that expands outward — and may eventually go on to become part of stars that form elsewhere in our galaxy.
Astronomers using the NASA/ESA/CSA James Webb Space Telescope have identified two stars responsible for generating carbon-rich dust a mere 5000 light-years away in our own Milky Way galaxy. As the massive stars in Wolf-Rayet 140 swing past one another on their elongated orbits, their winds collide and produce the carbon-rich dust. For a few months every eight years, the stars form a new shell of dust that expands outward — and may eventually go on to become part of stars that form elsewhere in our galaxy.
Every shell is racing away from the stars at more than 2600 kilometers per second, almost 1% the speed of light.
Wolf-Rayet 140 lies just over 5000 light-years away in our Milky Way galaxy.
Credit:
NASA, ESA, CSA, STScI, E. Lieb (University of Denver), R. Lau (NSF NOIRLab), J. Hoffman (University of Denver)
Astronomers using the NASA/ESA/CSA James Webb Space Telescope James Webb Space Telescope have identified two stars responsible for generating carbon-rich dust a mere 5000 light-years away in our own Milky Way galaxy. As the massive stars in Wolf-Rayet 140 swing past one another on their elongated orbits, their winds collide and produce the carbon-rich dust. For a few months every eight years, the stars form a new shell of dust that expands outward — and may eventually go on to become part of stars that form elsewhere in our galaxy.
Every shell is racing away from the stars at more than 2600 kilometers per second, almost 1% the speed of light.
Wolf-Rayet 140 lies just over 5000 light-years away in our Milky Way galaxy.
Credit:
NASA, ESA, CSA, STScI, E. Lieb (University of Denver), R. Lau (NSF NOIRLab), J. Hoffman (University of Denver)
Compare the two mid-infrared images taken by the James Webb Space Telescope of Wolf-Rayet 140, a system of dust shells ejected by two massive stars that are in an elongated orbit.
Look to the top right of the first two images. Two triangles are matched up to show how much difference 14 months makes: the dust is racing away from the central stars at almost 1% the speed of light and no longer lines up in the third image.
When the winds of the massive stars, which are buried within the white central region in the first and second images, collide and that material compresses, it forms carbon-rich dust that moves away from the stars. This occurs for a few months during each eight-year orbit, which is one reason why the dust isn’t ‘sprayed’ equally around the stars to form complete shells.
Wolf-Rayet 140 lies just over 5000 light-years away in our Milky Way galaxy.
The left and center images show two observations of Wolf-Rayet 140, from July 2022 at left and from September 2023 at center.
Credit:
NASA, ESA, CSA, STScI, E. Lieb (University of Denver), R. Lau (NSF NOIRLab), J. Hoffman (University of Denver)
Astronomers have long tried to track down how elements like carbon, which is essential for life, become widely distributed across the Universe. Now, the James Webb Space Telescope has examined one ongoing source of carbon-rich dust in our own Milky Way galaxy in greater detail: Wolf-Rayet 140 [1], a system of two massive stars that follow a tight, elongated orbit.
As they swing past one another (within the central white dot in the Webb images), the stellar winds from each star slam together, the material compresses, and carbon-rich dust forms. Webb’s latest observations show 17 dust shells shining in mid-infrared light that are expanding at regular intervals into the surrounding space.
“The telescope confirmed that these dust shells are real, and its data also showed that the dust shells are moving outward at consistent velocities, revealing visible changes over incredibly short periods of time,”
said Emma Lieb, the lead author of the new paper and a doctoral student at the University of Denver in Colorado.
Every shell is racing away from the stars at more than 2600 kilometres per second, almost 1% the speed of light.
“We are used to thinking about events in space taking place slowly, over millions or billions of years,” added Jennifer Hoffman, a co-author and a professor at the University of Denver. “In this system, the observatory is showing that the dust shells are expanding from one year to the next.”
“Seeing the real-time movement of these shells between Webb’s observations that were taken only 13 months apart is truly remarkable,” said Olivia Jones, a co-author at the UK Astronomy Technology Centre, Edinburgh. “These new results are giving us a first glimpse of the potential role of such massive binaries as factories of dust in the Universe.”
Like clockwork, the stars’ winds generate dust for several months every eight years, as the pair make their closest approach during a wide, elongated orbit. Webb also shows where dust formation stops — look for the darker region at top left in both images.
The telescope’s mid-infrared images detected shells that have persisted for more than 130 years (older shells have dissipated enough that they are now too dim to detect). The researchers speculate that the stars will ultimately generate tens of thousands of dust shells over hundreds of thousands of years.
“Mid-infrared observations are absolutely crucial for this analysis, since the dust in this system is fairly cool. Near-infrared and visible-light observations would only show the shells that are closest to the star,” explained Ryan Lau, a co-author and astronomer at NSF NOIRLab in Tucson, Arizona, who led the initial research about this system. “With these incredible new details, the telescope is also allowing us to study exactly when the stars are forming dust — almost to the day.”
The distribution of the dust isn’t uniform. Though these differences aren’t obvious in Webb’s images, the team found that some of the dust has ‘piled up’, forming amorphous, delicate clouds that are as large as our entire Solar System. Many other individual dust particles float freely. Every speck is as small as one-hundredth the width of a human hair. Clumpy or not, all of the dust moves at the same speed and is carbon rich.
The future of this system
What will happen to these stars over millions or billions of years, after they have finished ‘spraying’ their surroundings with dust? The Wolf-Rayet star in this system is 10 times more massive than the Sun and nearing the end of its life. In its final ‘act’, this star will either explode as a supernova — possibly blasting away some or all of the dust shells — or collapse into a black hole, which would leave the dust shells intact.
Though no one can predict with any certainty what will happen, researchers are rooting for the black hole scenario.
“A major question in astronomy is, where does all the dust in the universe come from?” Lau said. “If carbon-rich dust like this survives, it could help us begin to answer that question.”
“We know carbon is necessary for the formation of rocky planets and solar systems like ours,” Hoffman added. “It’s exciting to get a glimpse into how binary star systems not only create carbon-rich dust, but also propel it into our galactic neighborhood.”
These results have been published in the Astrophysical Journal Letters and were presented in a press conference at the 245th meeting of the American Astronomical Society in National Harbor, Maryland.
Notes
[1] A Wolf-Rayet star is born with at least 25 times more mass than our Sun and is nearing the end of its life, when it will likely collapse directly to black hole, or explode as a supernova. Burning hotter than in its youth, a Wolf-Rayet star generates powerful winds that push huge amounts of gas into space. The Wolf-Rayet star in this particular pair may have shed more than half its original mass via this process.
Firefly Sparkle Found: first actively forming galaxy as lightweight as young Milky Way
For the first time, the NASA/ESA/CSA James Webb Space Telescope has detected and ‘weighed’ a galaxy that not only existed around 600 million years after the Big Bang, but also has a mass that is similar to what our Milky Way galaxy’s mass might have been at the same stage of development. Other galaxies Webb has detected at this period in the history of the Universe are significantly more massive. Nicknamed the Firefly Sparkle, this galaxy is gleaming with star clusters — 10 in all — each of which researchers examined in great detail.
“I didn’t think it would be possible to resolve a galaxy that existed so early in the Universe into so many distinct components, let alone find that its mass is similar to our own galaxy’s when it was in the process of forming,” said Lamiya Mowla, co-lead author of the paper and an assistant professor at Wellesley College in Massachusetts. “There is so much going on inside this tiny galaxy, including so many different phases of star formation.”
Thousands of glimmering galaxies are bound together by their own gravity, making up a massive cluster formally classified as MACS J1423. The largest bright white oval is a supergiant elliptical galaxy that is the dominant member of this galaxy cluster. The galaxy cluster acts like a lens, magnifying and distorting the light from objects that lie well behind it, an effect known as gravitational lensing that has big research benefits. Astronomers can study lensed galaxies in detail, like the Firefly Sparkle galaxy. This 2023 image is from the James Webb Space Telescope’s NIRCam (Near-InfraRed Camera). Researchers used Webb to survey the same field that the Hubble Space Telescope imaged in 2010. Thanks to its specialisation in high-resolution near-infrared imagery, Webb was able to show researchers many more galaxies in far more detail. Credit: NASA, ESA, CSA, STScI, C. Willott (NRC-Canada), L. Mowla (Wellesley College), K. Iyer (Columbia)
Webb was able to image the galaxy in sufficient detail for two reasons. One is a benefit of the cosmos: a massive foreground galaxy cluster radically enhanced the distant galaxy’s appearance through a natural effect known as gravitational lensing. And when combined with the telescope’s specialisation in high-resolution imaging of infrared light, Webb delivered unprecedented new data about the galaxy’s contents.
“Without the benefit of this gravitational lens, we would not be able to resolve this galaxy,” said Kartheik Iyer, co-lead author and NASA Hubble Fellow at Columbia University in New York. “We knew to expect it based on current physics, but it’s surprising that we actually saw it.”
Mowla, who spotted the galaxy in Webb’s image, was drawn to its gleaming star clusters, because objects that sparkle typically indicate they are extremely clumpy and complicated. Since the galaxy looks like a ‘sparkle’ or swarm of fireflies on a warm summer night, they named it the Firefly Sparkle galaxy.
Reconstructing the galaxy’s appearance
The research team modelled what the galaxy might have looked like if its image weren’t stretched by gravitational lensing and discovered that it resembled an elongated raindrop. Suspended within it are two star clusters toward the top and eight toward the bottom.
“Our reconstruction shows that clumps of actively forming stars are surrounded by diffuse light from other unresolved stars,” said Iyer. “This galaxy is literally in the process of assembling.”
Webb’s data show the Firefly Sparkle galaxy is on the smaller side, falling into the category of a low-mass galaxy. Billions of years will pass before it builds its full heft and a distinct shape. “Most of the other galaxies Webb has shown us aren’t magnified or stretched, and we are not able to see their ‘building blocks’ separately. With Firefly Sparkle, we are witnessing a galaxy being assembled brick by brick,” Mowla said.
Stretched out and shining, ready for close analysis
Since the image of the galaxy is warped into a long arc, the researchers easily picked out 10 distinct star clusters, which are emitting the bulk of the galaxy’s light. They are represented here in shades of pink, purple, and blue. Those colours in Webb’s images and its supporting spectra confirmed that star formation didn’t happen all at once in this galaxy, but was staggered in time.
“This galaxy has a diverse population of star clusters, and it is remarkable that we can see them separately at such an early age of the Universe,” said Chris Willott of the National Research Council Canada, a co-author and the observation programme’s principal investigator. “Each clump of stars is undergoing a different phase of formation or evolution.”
The galaxy’s projected shape shows that its stars haven’t settled into a central bulge or a thin, flattened disc, another piece of evidence that the galaxy is still forming.
For the first time, astronomers have identified a still-forming galaxy that weighs about the same as our Milky Way if we could wind back the clock to see our galaxy as it developed. The newly identified galaxy, the Firefly Sparkle, is in the process of assembling and forming stars, and existed about 600 million years after the Big Bang. The image of the galaxy is stretched and warped by a natural effect known as gravitational lensing, which allowed researchers to glean far more information about its contents. (In some areas of Webb’s image, the galaxy is magnified over 40 times.) While it took shape, the galaxy gleamed with star clusters in a range of infrared colours, which are scientifically meaningful. They indicate that the stars formed at different periods, not all at once. Since the galaxy image is stretched into a long line in Webb’s observations, researchers were able to identify 10 distinct star clusters and study them individually, along with the cocoon of diffuse light from the additional, unresolved stars surrounding them. That’s not always possible for distant galaxies that aren’t lensed. Instead, in many cases researchers can only draw conclusions that apply to an entire galaxy. “Most of the other galaxies Webb has shown us aren’t magnified or stretched and we are not able to see the ‘building blocks’ separately. With Firefly Sparkle, we are witnessing a galaxy being assembled brick by brick,” explains astronomer Lamiya Mowla. There are two companion galaxies ‘hovering’ close by, which may ultimately affect how this galaxy forms and builds mass over billions of years. Firefly Sparkle is only about 6500 light-years away from its first companion, and 42 000 light-years from its second companion. Let’s compare these figures to objects that are closer to home: the Sun is about 26 000 light-years from the centre of our Milky Way galaxy, and the Milky Way is about 100 000 light-years across. Not only are Firefly Sparkle’s companions very close, the researchers also suspect that they are orbiting one another. Credit: NASA, ESA, CSA, STScI, C. Willott (NRC-Canada), L. Mowla (Wellesley College), K. Iyer (Columbia)
‘Glowing’ companions
Researchers can’t predict how this disorganised galaxy will build up and take shape over billions of years, but there are two galaxies that the team confirmed are ‘hanging out’ within a tight perimeter and may influence how it builds mass over billions of years.
Firefly Sparkle is only 6500 light-years away from its first companion, and its second companion is separated by 42 000 light-years. For context, the fully formed Milky Way is about 100 000 light-years across — all three would fit inside it. Not only are its companions very close, the researchers also think that they are orbiting one another.
Each time one galaxy passes another, gas condenses and cools, allowing new stars to form in clumps, adding to the galaxies’ masses.
“It has long been predicted that galaxies in the early Universe form through successive interactions and mergers with other tinier galaxies,” said Yoshihisa Asada, a co-author and doctoral student at Kyoto University in Japan. “We might be witnessing this process in action.”
“This is just the first of many such galaxies JWST will discover, as we are only starting to use these cosmic microscopes”, added team member Maruša Bradač of the University of Ljubljana in Slovenia. “Just like microscopes let us see pollen grains from plants, the incredible resolution of Webb and the magnifying power of gravitational lensing let us see the small pieces inside galaxies. Our team is now analysing all early galaxies, and the results are all pointing in the same direction: we have yet to learn much more about how those early galaxies formed.”
The team’s research relied on data from Webb’s CAnadian NIRISS Unbiased Cluster Survey, which include near-infrared images from NIRCam (Near-InfraRed Camera) and spectra from the microshutter array aboard NIRSpec (Near-Infrared Spectrograph). The CANUCS data intentionally covered a field that NASA’s Hubble Space Telescope imaged as part of its Cluster Lensing And Supernova survey with Hubble programme.
This work was published on 12 December 2024 in the journal Nature.
Thousands of glimmering galaxies are bound together by their own gravity, making up a massive cluster formally classified as MACS J1423. The largest bright white oval is a supergiant elliptical galaxy that is the dominant member of this galaxy cluster. The galaxy cluster acts like a lens, magnifying and distorting the light from objects that lie well behind it, an effect known as gravitational lensing that has big research benefits. Astronomers can study lensed galaxies in detail, like the Firefly Sparkle galaxy. This 2023 image is from the James Webb Space Telescope’s NIRCam (Near-Infrared Camera). Researchers used Webb to survey the same field the Hubble Space Telescope imaged in 2010. Thanks to its specialisation in high-resolution near-infrared imagery, Webb was able to show researchers many more galaxies in far more detail. The north and east compass arrows show the orientation of the image on the sky. The scale bar is labelled in arcseconds, which is a measure of angular distance on the sky. One arcsecond is equal to an angular measurement of 1/3600 of one degree. There are 60 arcminutes in a degree and 60 arcseconds in an arcminute. (The full Moon has an angular diameter of about 30 arcminutes.) The actual size of an object that covers one arcsecond on the sky depends on its distance from the telescope. This image shows invisible near-infrared wavelengths of light that have been translated into visible-light colours. The colour key shows which NIRCam filters were used when collecting the light. The colour of each filter name is the visible light colour used to represent the infrared light that passes through that filter. NIRCam filters from left to right: F115W and F150W are blue; F200W and F277W are green; F356W and F444W are red. Credit: NASA, ESA, CSA, STScI, C. Willott (NRC-Canada), L. Mowla (Wellesley College), K. Iyer (Columbia)
Hubble sees aftermath of galaxy’s scrape with Milky Way, at the Large Magellanic Cloud (LMC)
Encounter blew away most of smaller galaxy’s gaseous halo
This artist’s concept shows a closeup of the Large Magellanic Cloud (LMC), a dwarf galaxy that is one of the Milky Way galaxy’s nearest neighbours. Scientists think that the LMC has just completed its closest approach to the much more massive Milky Way. This encounter has blown away most of the spherical halo of gas that surrounds the LMC. The bright purple bow shocks represent the leading edge of the LMC’s halo, which is being compressed as the Milky Way’s halo pushes back against the incoming LMC. The pressure is stripping much of the LMC’s halo and blowing it backward into a streaming tail of gas. The dwarf galaxy is cocooned within its remaining halo. An actual science image of the LMC is combined with an artist’s rendering of the galaxy’s halo. Credit: NASA, ESA, R. Crawford (STScI)
In an epic story of survival witnessed by the NASA/ESA Hubble Space Telescope, one of our nearest galactic neighbours has crashed through the Milky Way galaxy’s gaseous halo and lived to tell the tale. But in the process, this dwarf galaxy, called the Large Magellanic Cloud (LMC), has been stripped of most of its own surrounding halo of gas. Researchers were surprised to find such an extremely small gaseous halo remaining — one around 10 times smaller than halos of other galaxies of similar mass. Still, the LMC has held onto enough of its gas to keep forming new stars. A smaller galaxy wouldn’t have survived such an encounter. This is the first time astronomers have been able to measure the size of the LMC’s halo — something they could do only with Hubble.
The Large Magellanic Cloud, also called the LMC, is one of the Milky Way galaxy’s nearest neighbours. This dwarf galaxy looms large in the southern nighttime sky at 20 times the apparent diameter of the full Moon.
Many researchers theorise that the LMC is not in orbit around our galaxy, but is just passing by. Those scientists think that the LMC has just completed its closest approach to the much more massive Milky Way. This passage has blown away most of the spherical halo of gas that surrounds the LMC.
Now, for the first time, astronomers have been able to measure the size of the LMC’s halo — something they could do only with Hubble. In a new study published in the Astrophysical Journal Letters, researchers were surprised to find that it is so extremely small — about 50 000 light-years across. That’s around 10 times smaller than the halos of other galaxies that are the same mass as the LMC. Its compactness tells the story of its encounter with the Milky Way.
“The LMC is a survivor,” said Andrew Fox of AURA/STScI for the European Space Agency in Baltimore, who was principal investigator on the observations. “Even though it’s lost a lot of its gas, it’s got enough left to keep forming new stars. So new star-forming regions can still be created. A smaller galaxy wouldn’t have lasted — there would be no gas left, just a collection of aging red stars.”
Though quite a bit the worse for wear, the LMC still retains a compact, stubby halo of gas — something that it wouldn’t have been able to hold onto gravitationally had it been less massive. The LMC is 10 percent the mass of the Milky Way.
“Because of the Milky Way’s own giant halo, the LMC’s gas is getting truncated, or quenched,” explained STScI’s Sapna Mishra, the lead author of the paper chronicling this discovery. “But even with this catastrophic interaction with the Milky Way, the LMC is able to retain 10 percent of its halo because of its high mass.”
This artist’s concept shows the Large Magellanic Cloud, or LMC, in the foreground as it passes through the gaseous halo of the much more massive Milky Way galaxy. The encounter has blown away most of the spherical halo of gas that surrounds the LMC, as illustrated by the trailing gas stream reminiscent of a comet’s tail. Still, a compact halo remains, and scientists do not expect this residual halo to be lost. The team surveyed the halo by using the background light of 28 quasars, an exceptionally bright type of active galactic nucleus that shines across the Universe like a lighthouse beacon. Their light allows scientists to ‘see’ the intervening halo gas indirectly through the absorption of the background light. The lines represent the Hubble Space Telescope’s view from its orbit around Earth to the distant quasars through the LMC’s gas. Credit: NASA, ESA, R. Crawford (STScI)
A gigantic hair dryer
Most of the LMC’s halo was blown away by a phenomenon called ram-pressure stripping. The dense environment of the Milky Way pushes back against the incoming LMC and creates a wake of gas trailing the dwarf galaxy — like the tail of a comet.
“I like to think of the Milky Way as this giant hairdryer, and it’s blowing gas off the LMC as it comes into us,” said Fox. “The Milky Way is pushing back so forcefully that the ram pressure has stripped off most of the original mass of the LMC’s halo. There’s only a little bit left, and it’s this small, compact leftover that we’re seeing now.”
As the ram pressure pushes away much of the LMC’s halo, the gas slows down and eventually will rain into the Milky Way. But because the LMC has just passed its closest approach to the Milky Way and is moving outward into deep space again, scientists do not expect the whole halo will be lost.
Only with Hubble
To conduct this study, the research team analysed ultraviolet observations from the Mikulski Archive for Space Telescopes at STScI. Most ultraviolet light is blocked by Earth’s atmosphere, so it cannot be observed with ground-based telescopes. Hubble is currently the only space telescope that is tuned to detect these wavelengths of light, so this study was only possible with Hubble.
The team surveyed the halo by using the background light of 28 bright quasars. The brightest type of active galactic nucleus, quasars are believed to be powered by supermassive black holes. Shining like lighthouse beacons, they allow scientists to ‘see’ the intervening halo gas indirectly through the absorption of the background light. Quasars reside throughout the Universe at extreme distances from our galaxy.
The scientists used data from Hubble’s Cosmic Origins Spectrograph (COS) to detect the presence of the halo gas by the way it absorbs certain colours of light from background quasars. A spectrograph breaks light into its component wavelengths to reveal clues to the object’s state, temperature, speed, quantity, distance, and composition. With COS, they measured the velocity of the gas around the LMC, which allowed them to determine the size of the halo.
Because of its mass and proximity to the Milky Way, the LMC is a unique astrophysics laboratory. Seeing the LMC’s interplay with our galaxy helps scientists understand what happened in the early Universe, when galaxies were closer together. It also shows just how messy and complicated the process of galaxy interaction is.
“This is a fantastic example of the cutting-edge science still being enabled by Hubble’s unique capabilities,” said Professor Carole Mundell, Director of Science at the European Space Agency. “This result gives us precious new insights into the complex history of the Milky Way and its nearby satellite galaxies.”
Looking to the future
The team will next study the front side of the LMC’s halo, an area that has not yet been explored.
“In this new programme, we are going to probe five sightlines in the region where the LMC’s halo and the Milky Way’s halo are colliding,” said co-author Scott Lucchini of the Center for Astrophysics | Harvard & Smithsonian. “This is the location where the halos are compressed, like two balloons pushing against each other.”
This artist’s concept illustrates the Large Magellanic Cloud’s (LMC’s) encounter with the Milky Way galaxy’s gaseous halo. In the top panel, at the middle of the right side, the LMC begins crashing through our galaxy’s much more massive halo. The bright purple bow shock represents the leading edge of the LMC’s halo, which is being compressed as the Milky Way’s halo pushes back against the incoming LMC. In the middle panel, part of the halo is being stripped and blown back into a streaming tail of gas that eventually will rain into the Milky Way. The bottom panel shows the progression of this interaction, as the LMC’s comet-like tail becomes more defined. A compact LMC halo remains. Because the LMC is just past its closest approach to the Milky Way and is moving outward into deep space again, scientists do not expect the residual halo will be lost. Credit: NASA, ESA, R. Crawford (STScI)
More information
The Hubble Space Telescope is a project of international cooperation between ESA and NASA.
Image credit: NASA, ESA, R. Crawford (STScI)


 molecular cloud, the largest star-forming cloud in the Milky Way")


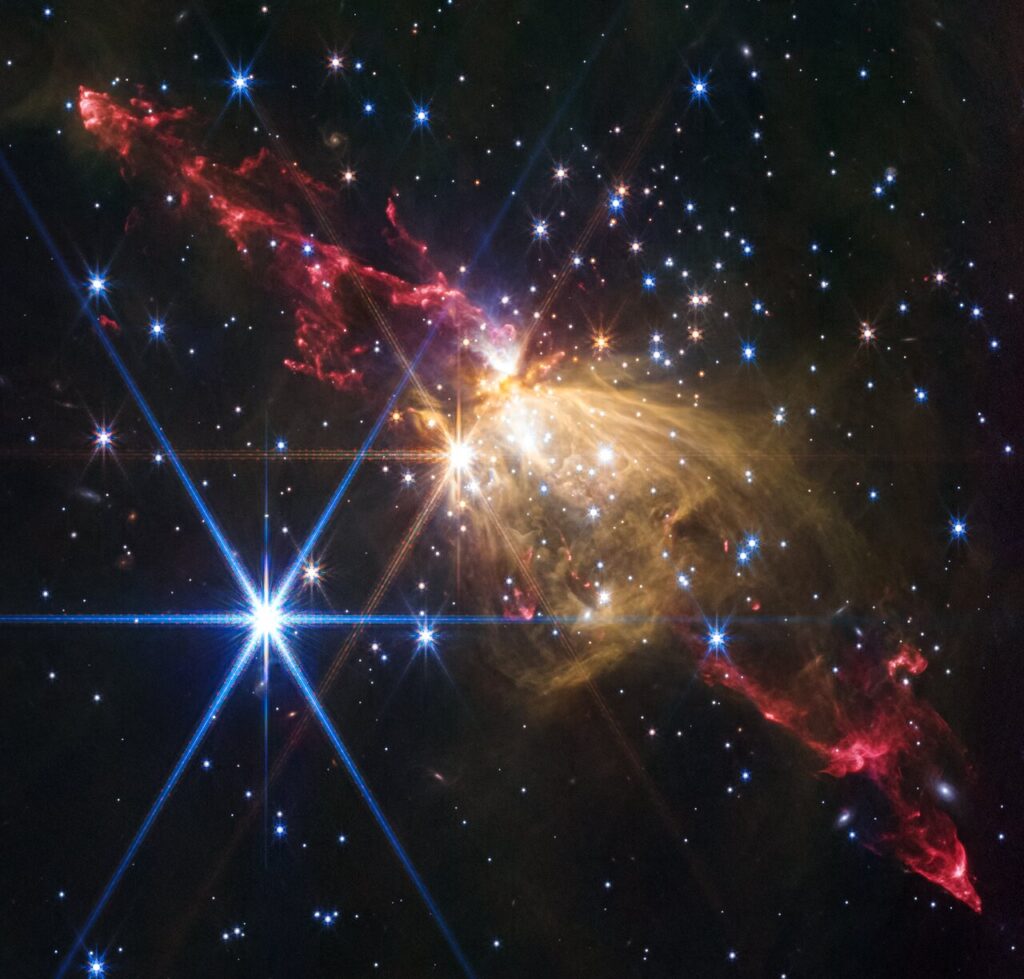
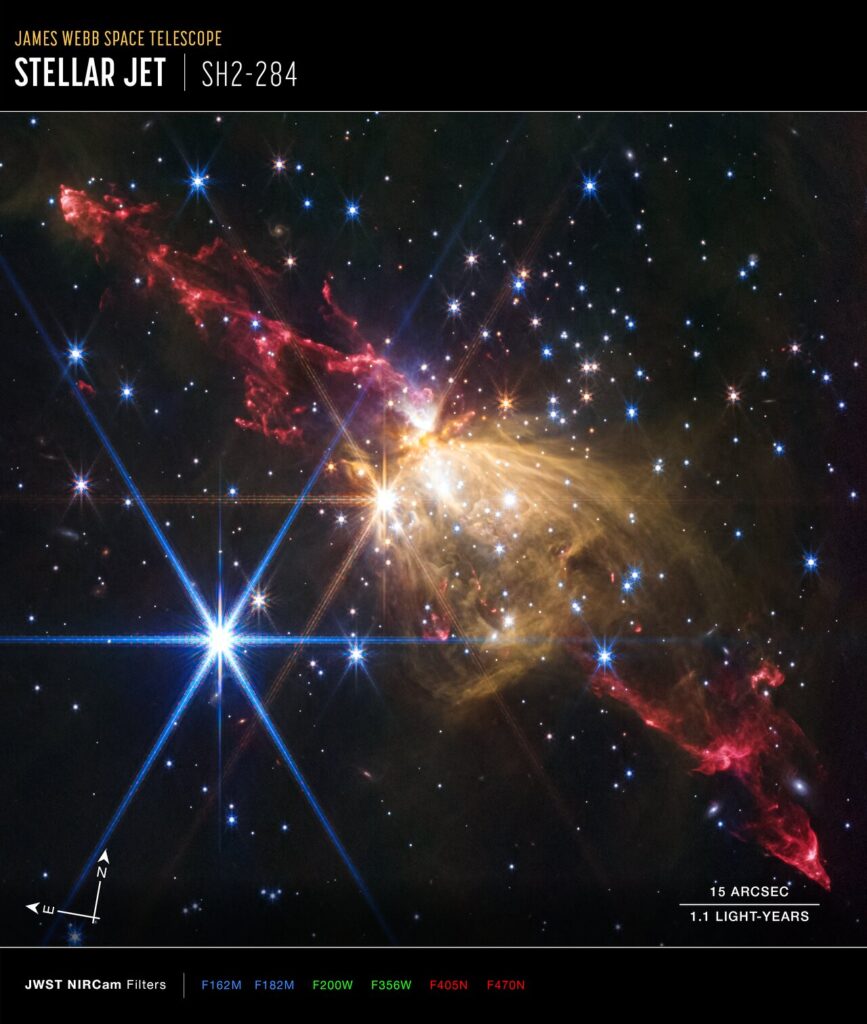


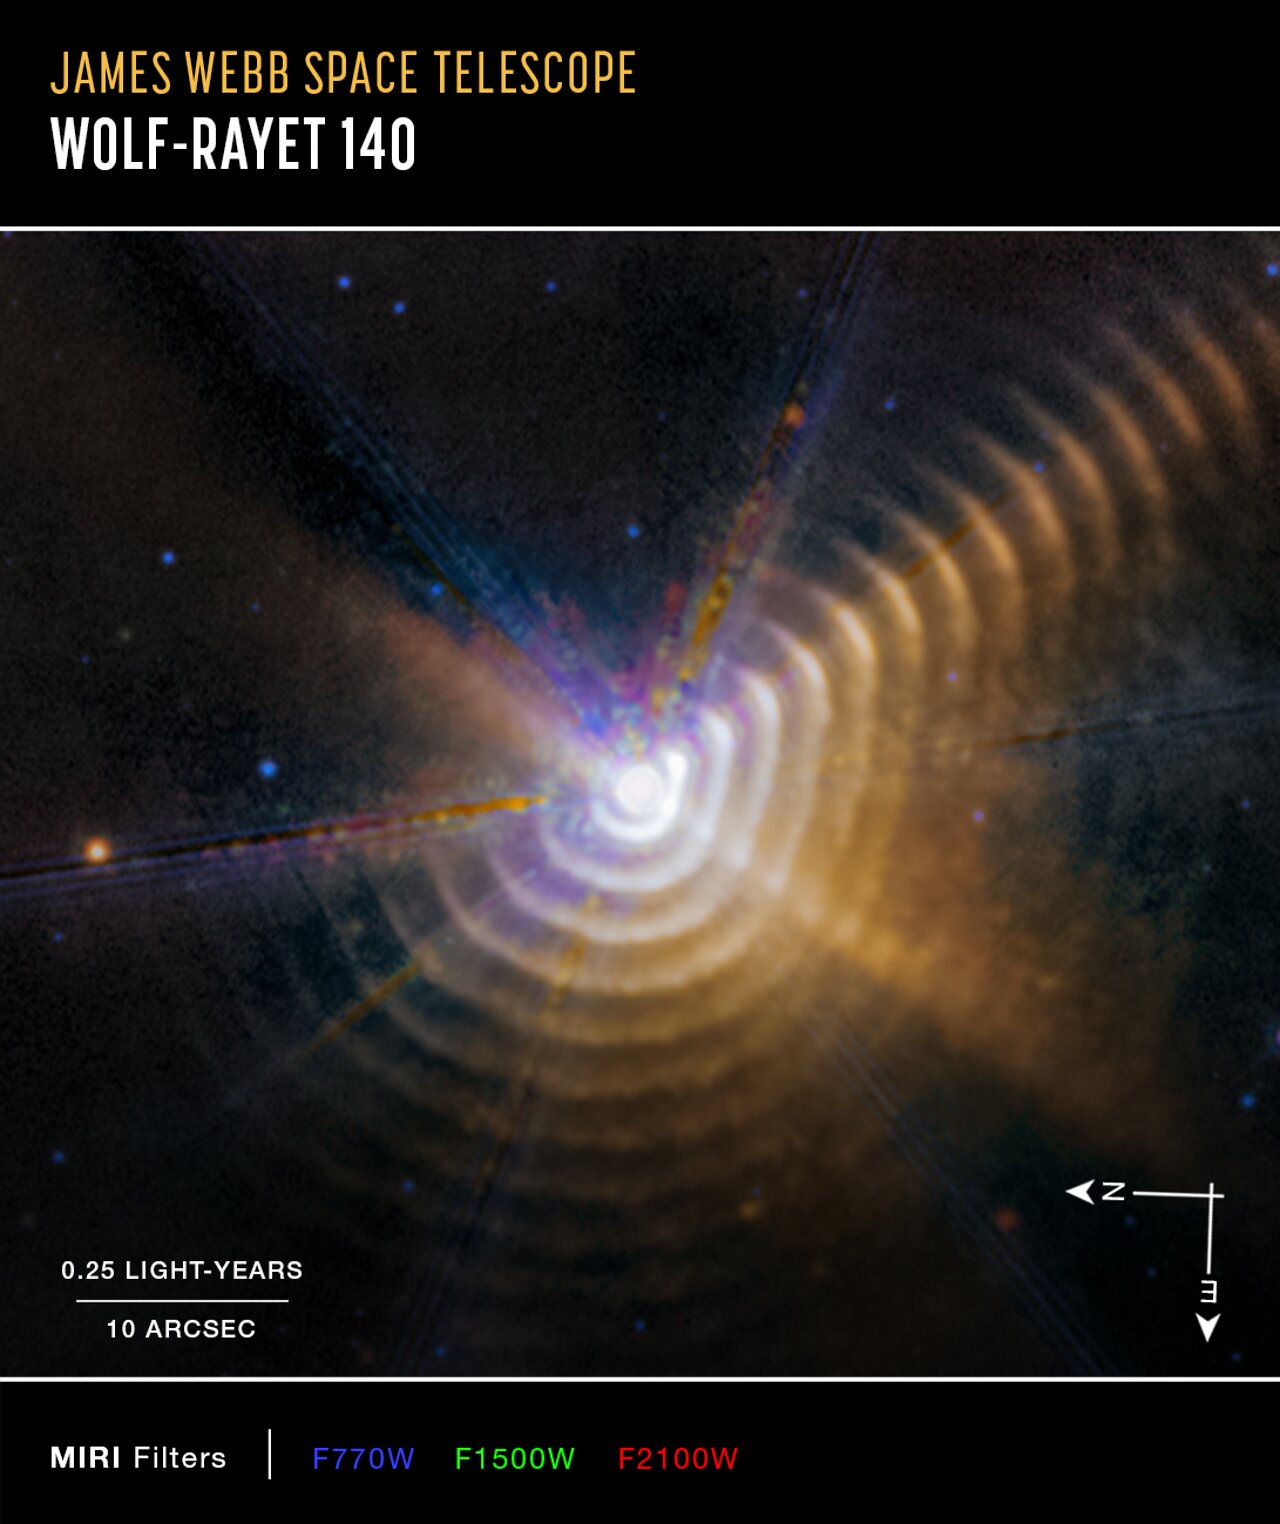
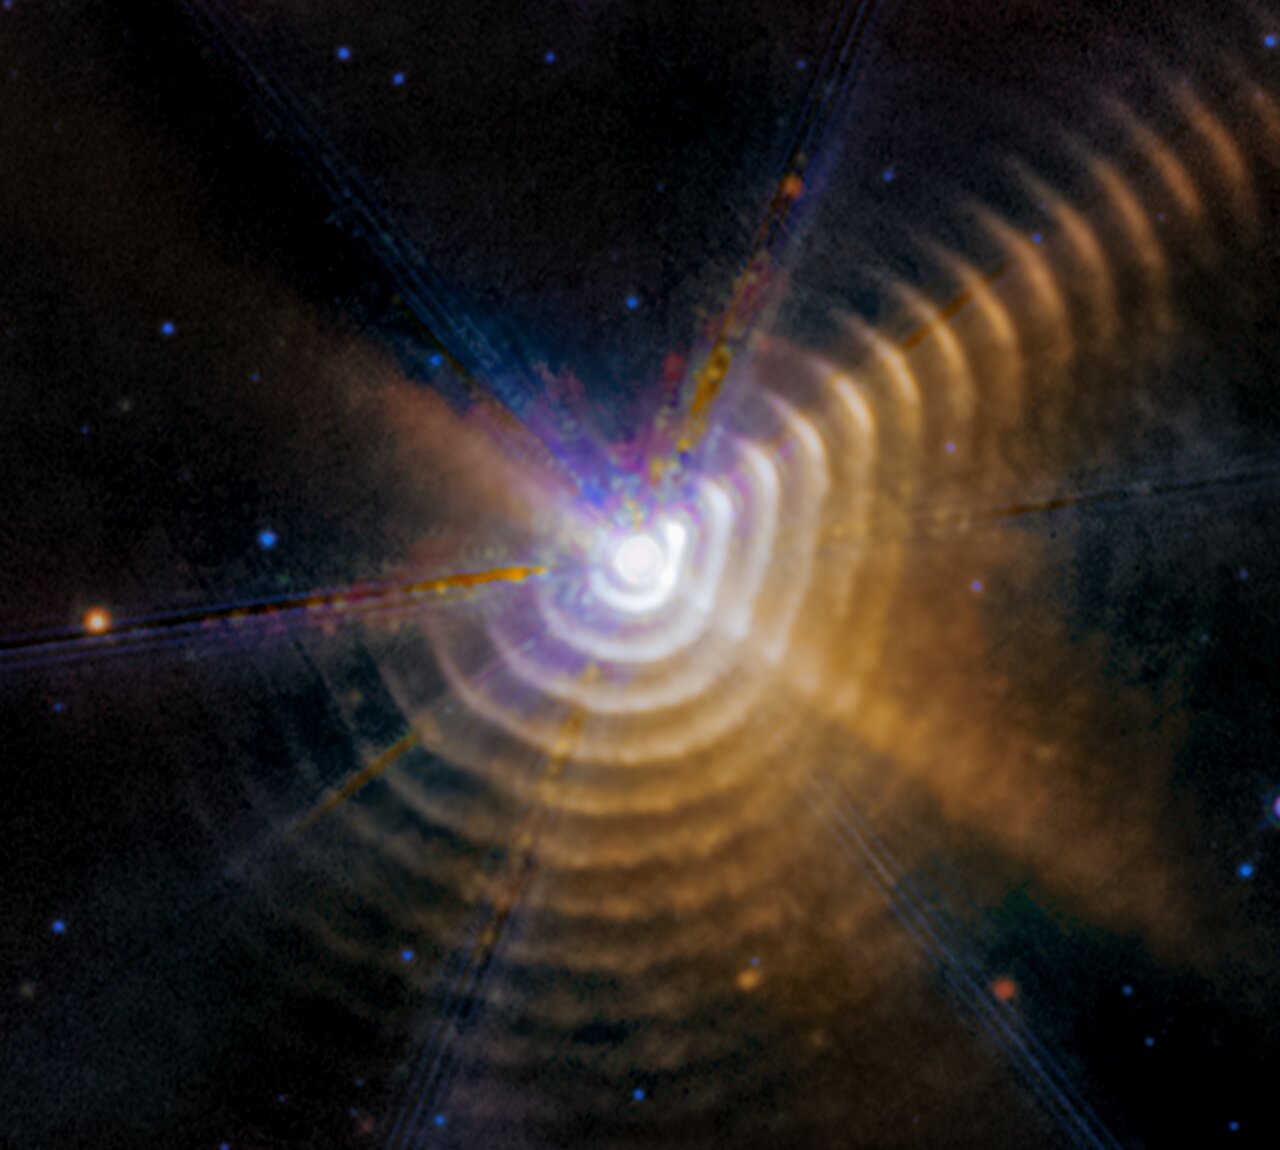
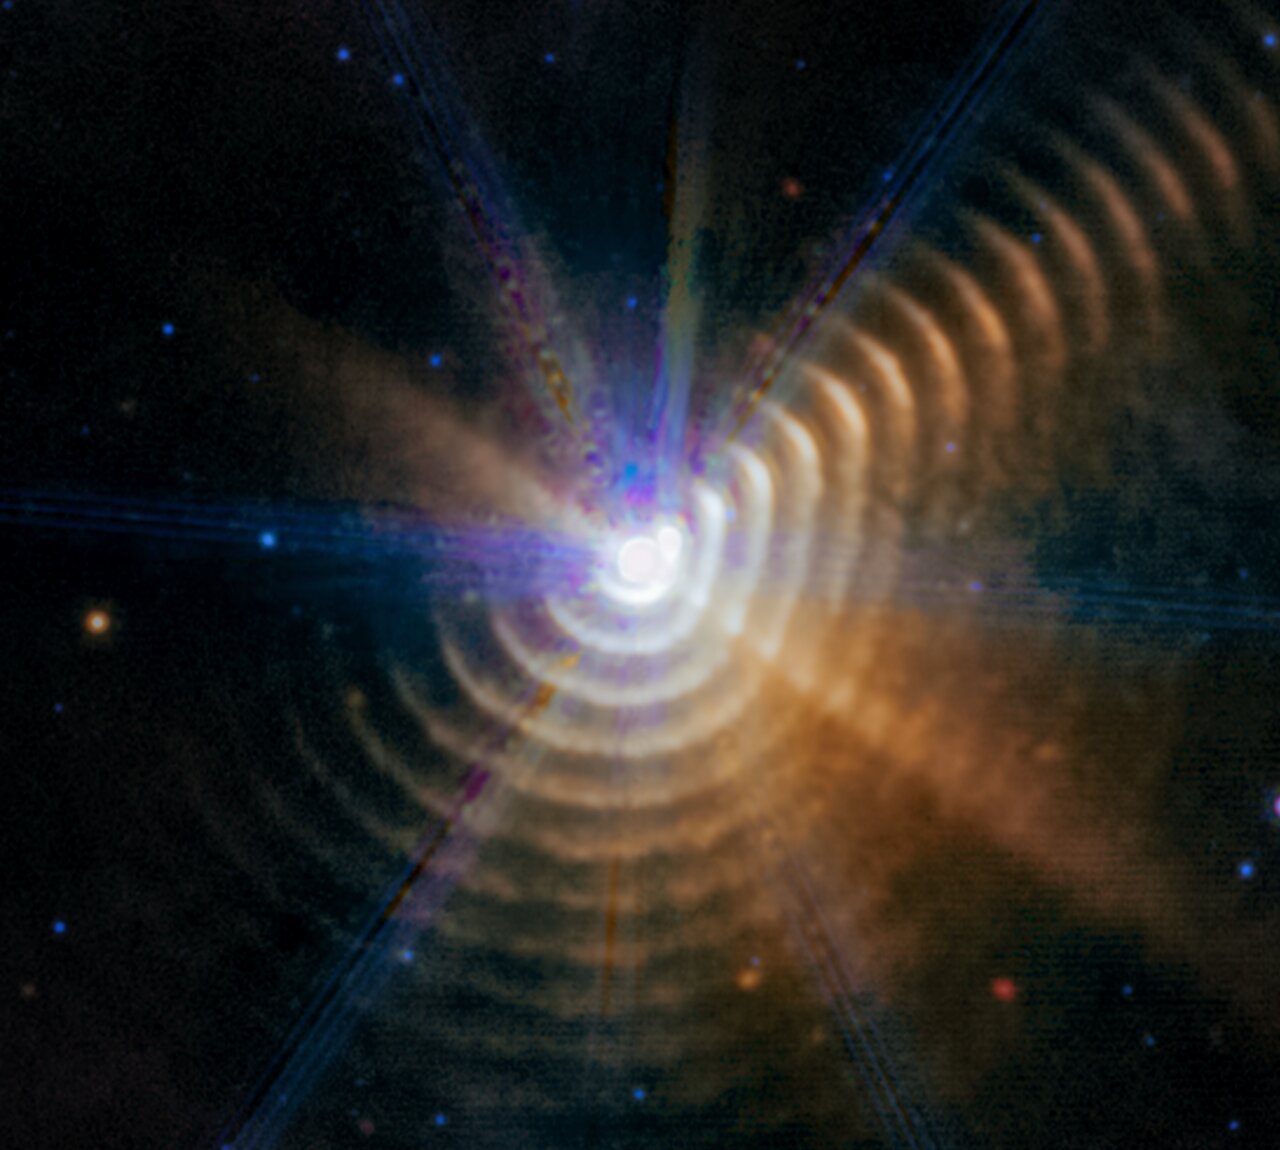

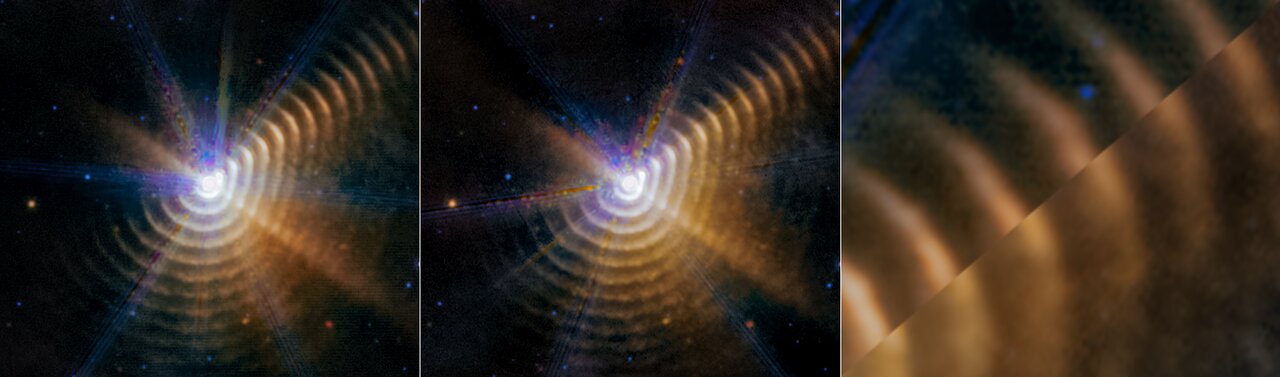


")


