Ad
Ad
Ad
Tag

Jupiter

Browsing

Webb reveals new details in Jupiter’s aurora

The NASA/ESA/CSA James Webb Space Telescope has captured new details of the auroras on our Solar System’s largest planet. The dancing lights observed on Jupiter are hundreds of times brighter than those seen on Earth. With Webb’s advanced sensitivity, astronomers have studied the phenomena to better understand Jupiter’s magnetosphere.

Three panels, each showing a close-up near-infrared image of Jupiter’s north pole, in shades of orange. The planet is mostly dark. Thick, bright arcs and rings caused by aurorae cover the pole. The centre and right panels each show the aurora a few minutes later in time, as Webb’s field of view slowly scans over the planet.
The NASA/ESA/CSA James Webb Space Telescope has captured new details of the auroras on our Solar System’s largest planet. The dancing lights observed on Jupiter are hundreds of times brighter than those seen on Earth.
These observations of Jupiter’s auroras were captured with Webb’s Near-InfraRed Camera (NIRCam) on 25 December 2023 (F335M filter). Scientists found that the emission from the trihydrogen ion, known as H3+, is far more variable than previously believed. H3+ is created by the impact of high energy electrons on molecular hydrogen. Because this emission shines brightly in the infrared, Webb’s instruments are well equipped to observe it.
Credit: ESA/Webb, NASA, CSA, J. Nichols (University of Leicester), M. Zamani (ESA/Webb)

The auroras are created when high-energy particles enter a planet’s atmosphere near its magnetic poles and collide with atoms of gas. Not only are the auroras on Jupiter huge in size, they are also hundreds of times more energetic than auroras on Earth. Here, auroras are caused by solar storms — when charged particles rain down on the upper atmosphere, excite gases and cause them to glow colours of red, green and purple. Meanwhile, Jupiter has an additional source for its auroras; the strong magnetic field of the gas giant grabs charged particles from its surroundings. This includes not only the charged particles within the solar wind but also the particles thrown into space by its orbiting moon Io, known for its numerous and large volcanoes. Io’s volcanoes spew particles that, remarkably, escape the moon’s gravity and orbit Jupiter. A barrage of charged particles unleashed by the sun during solar storms also reaches the planet. Jupiter’s large and powerful magnetic field captures charged particles and accelerates them to tremendous speeds. These speedy particles slam into the planet’s atmosphere at high energies, which excites the gas and causes it to glow.

Now, Webb’s unique capabilities are providing new insights into the auroras on Jupiter. The telescope’s sensitivity allows astronomers to increase the shutter speed in order to capture fast-varying auroral features. New data was captured with Webb’s Near-InfraRed Camera (NIRCam) on Christmas Day 2023 by a team of scientists led by Jonathan Nichols from the University of Leicester in the United Kingdom.

What a Christmas present it was – it just blew me away!” shared Nichols. “We wanted to see how quickly the auroras change, expecting it to fade in and out ponderously, perhaps over a quarter of an hour or so. Instead we observed the whole auroral region fizzing and popping with light, sometimes varying by the second.”

On the right is the planet Jupiter as seen in near-infrared light. Its clouds are dark blue and white in colour, with some red spots within the clouds, while its poles are tinged with green, yellow and red. A box over the north pole is overlain with more data in shades of orange, displaying aurorae as arcs and rings on the planet. To left, this area is shown larger in size and captioned “09:53:57 25 Dec. 2023”.
The NASA/ESA/CSA James Webb Space Telescope has captured new details of the auroras on our Solar System’s largest planet. The dancing lights observed on Jupiter are hundreds of times brighter than those seen on Earth.
These observations of Jupiter’s auroras (shown on the left of the above image) were captured with Webb’s Near-InfraRed Camera (NIRCam) on 25 December 2023 (F335M filter). Scientists found that the emission from the trihydrogen ion, known as H3+, is far more variable than previously believed. H3+ is created by the impact of high energy electrons on molecular hydrogen. Because this emission shines brightly in the infrared, Webb’s instruments are well equipped to observe it. The image on the right shows the planet Jupiter to indicate the location of the observed auroras, which was originally published in 2023 (F164N, F212N, and F360M filters).
Credit: NASA, ESA, CSA, STScI, Ricardo Hueso (UPV), Imke de Pater (UC Berkeley), Thierry Fouchet (Observatory of Paris), Leigh Fletcher (University of Leicester), Michael H. Wong (UC Berkeley), Joseph DePasquale (STScI), J. Nichols (University of Leicester), M. Zamani (ESA/Webb)

The team’s data found that the emission from the trihydrogen ion, known as H3+, is far more variable than previously believed. The observations will help develop scientists’ understanding of how Jupiter’s upper atmosphere is heated and cooled.

The team also uncovered some unexplained observations in their data.

“What made these observations even more special is that we also took pictures simultaneously in the ultraviolet with the NASA/ESA Hubble Space Telescope,” added Nichols. “Bizarrely, the brightest light observed by Webb had no real counterpart in Hubble’s pictures. This has left us scratching our heads. In order to cause the combination of brightness seen by both Webb and Hubble, we need to have an apparently impossible combination of high quantities of very low energy particles hitting the atmosphere – like a tempest of drizzle! We still don’t understand how this happens.” 

The team now plans to study this discrepancy between the Hubble and Webb data and to explore the wider implications for Jupiter’s atmosphere and space environment. They also intend to follow up this research with more Webb observations, which they can compare with data from NASA’s Juno spacecraft to better explore the cause of the enigmatic bright emission. These insights may also support the European Space Agency’s Jupiter Icy Moons Explorer, Juice, which is en route to Jupiter to make detailed observations of the giant gas planet and its three large ocean-bearing moons – Ganymede, Callisto and Europa. Juice will take a look at Jupiter’s auroras with seven unique scientific instruments, including two imagers. These close-up measurements will help us understand how the planet’s magnetic field and atmosphere interact, as well as the effect that charged particles from Io and the other moons have on Jupiter’s atmosphere.

Three panels, each showing a close-up near-infrared image of Jupiter’s north pole, in shades of orange. The planet is mostly dark. Thick, bright arcs and rings caused by aurorae cover the pole. The three panels each show the aurora a few minutes later in time - left to right, they are labelled “08:15:00”, “09:10:00” and “09:55:00”.
The NASA/ESA/CSA James Webb Space Telescope has captured new details of the auroras on our Solar System’s largest planet. The dancing lights observed on Jupiter are hundreds of times brighter than those seen on Earth.
These observations of Jupiter’s auroras were captured with Webb’s Near-InfraRed Camera (NIRCam) on 25 December 2023 (F335M filter). Scientists found that the emission from the trihydrogen ion, known as H3+, is far more variable than previously believed. H3+ is created by the impact of high energy electrons on molecular hydrogen. Because this emission shines brightly in the infrared, Webb’s instruments are well equipped to observe it.
The timestamps indicated in the lower right corner of each image indicates the time (UTC) when these observations were taken on 25 December 2023.
Credit: ESA/Webb, NASA, CSA, J. Nichols(University of Leicester), M. Zamani (ESA/Webb)

These results were obtained from data using Webb’s Cycle 2 observing programme #4566 and Hubble’s observing programme #17471. The results were published today in Nature Communications.

Press release from ESA Webb.

Webb exposes complex atmosphere of SIMP 0136, a starless super-Jupiter

An international team of researchers has discovered that previously observed variations in brightness across a free-floating planetary-mass object known as SIMP 0136 must be the result of a complex combination of atmospheric factors, and cannot be explained by clouds alone.

Using the NASA/ESA/CSA James Webb Space Telescope to monitor a broad spectrum of infrared light emitted by SIMP 0136 over two full rotation periods, the team was able to detect variations in cloud layers, temperature, and carbon chemistry that were previously hidden from view. The results provide crucial insight into the three-dimensional complexity of gas giant atmospheres within and beyond our solar system.

Rapidly rotating, free-floating

SIMP 0136 is a rapidly rotating, free-floating object roughly 13 times the mass of Jupiter, located in the Milky Way just 20 light-years from Earth. Although it is not classified as a gas giant exoplanet — it doesn’t orbit a star and may instead be a brown dwarf — SIMP 0136 is an ideal target for exo-meteorology: It is the brightest object of its kind in the northern sky. Because it is isolated, it can be observed directly and with no fear of light contamination or variability caused by a host star. And its short rotation period of just 2.4 hours makes it possible to survey very efficiently.

Prior to the Webb observations, SIMP 0136 had been studied extensively using ground-based observatories, as well as and NASA’s Spitzer Space Telescope and the NASA/ESA Hubble Space Telescope.

“We already knew that it varies in brightness, and we were confident that there are patchy cloud layers that rotate in and out of view and evolve over time,” explained Allison McCarthy, doctoral student at Boston University and lead author on a study published today in The Astrophysical Journal Letters“We also thought there could be temperature variations, chemical reactions, and possibly some effects of auroral activity affecting the brightness, but we weren’t sure.”

To figure it out, the team needed Webb’s ability to measure very precise changes in brightness over a broad range of wavelengths.

Charting thousands of infrared rainbows

Using NIRSpec (Near-Infrared Spectrograph), Webb captured thousands of individual 0.6- to 5.3-micron spectra — one every 1.8 seconds over more than three hours as the object completed one full rotation. This was immediately followed by an observation with MIRI (Mid-Infrared Instrument), which collected hundreds of measurements of 5- to 14-micron light — one every 19.2 seconds, over another rotation.

The result was hundreds of detailed light curves, each showing the change in brightness of a very precise wavelength (color) as different sides of the object rotated into view.

“To see the full spectrum of this object change over the course of minutes was incredible,” said principal investigator Johanna Vos, from Trinity College Dublin. “Until now, we only had a little slice of the near-infrared spectrum from Hubble, and a few brightness measurements from Spitzer.”

The team noticed almost immediately that there were several distinct light-curve shapes. At any given time, some wavelengths were growing brighter, while others were becoming dimmer or not changing much at all. A number of different factors must be affecting the brightness variations.

“Imagine watching Earth from far away. If you were to look at each color separately, you would see different patterns that tell you something about its surface and atmosphere, even if you couldn’t make out the individual features,” explained co-author Philip Muirhead, also from Boston University. “Blue would increase as oceans rotate into view. Changes in brown and green would tell you something about soil and vegetation.”

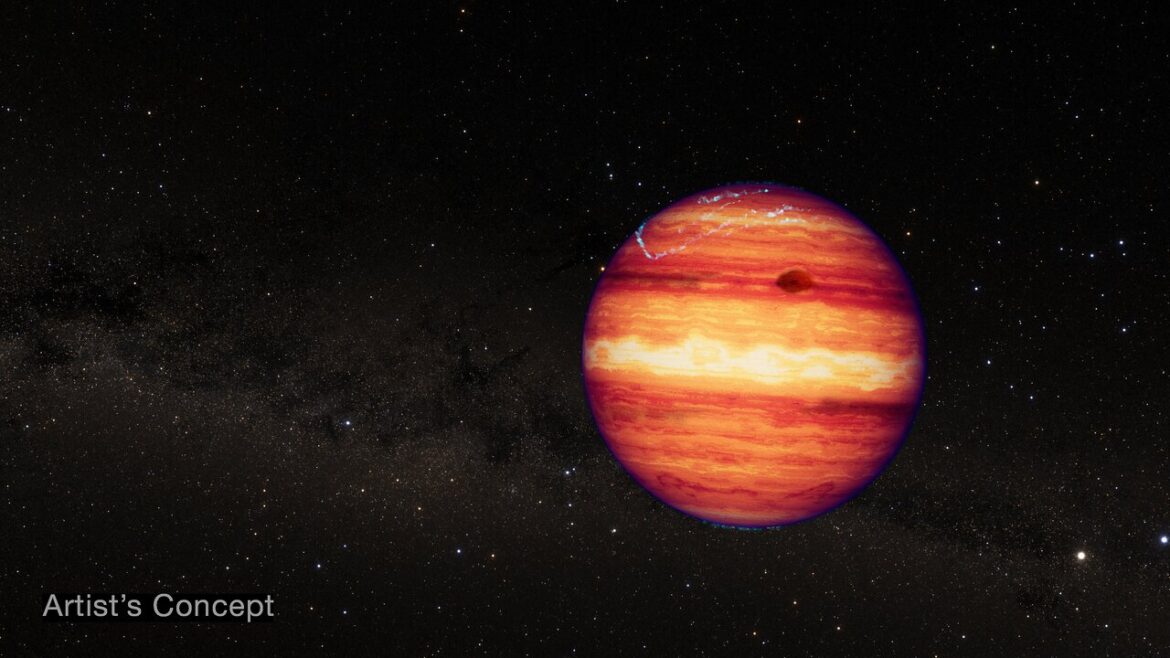
Illustration of a gas giant planet or brown dwarf on a background of distant stars.
This artist’s concept shows what the isolated planetary-mass object SIMP 0136 could look like based on recent observations from the NASA/ESA/CSA James Webb Space Telescope.
SIMP 0136 has a mass about 13 times that of Jupiter. Although it is thought to have the structure and composition of a gas giant, it is not technically classified as an exoplanet because it doesn’t orbit its own star.
The colors shown in the illustration represent near-infrared light, which is invisible to human eyes. SIMP 0136 is relatively warm — about 825 degrees Celsius or 1,100 kelvins — but is not hot enough to give off enough visible light to see from Earth, and is not illuminated by a host star. The bluish glow near the poles represents auroral energy (light given off by electrons spiraling in a magnetic field) which has been detected at radio wavelengths.
Researchers used NIRSpec (Near-infrared Spectrograph) and MIRI (Mid-Infrared Instrument) to monitor the brightness of SIMP 0136 over two full rotations in July 2023. By analyzing the change in brightness of different wavelengths over time, researchers were able to detect variability in cloud cover at different depths, temperature variations in the high atmosphere, and changes in carbon chemistry as different sides of the object rotated in and out of view.
SIMP 0136 is located within the Milky Way, about 20 light-years from Earth, in the constellation Pisces. It is the brightest isolated planet or brown dwarf visible from the Northern Hemisphere, and is thought to be about 200 million years old. This illustration is based on spectroscopic observations. Webb has not captured a direct image of the object.
Credit: NASA, ESA, CSA, J. Olmsted (STScI)

Patchy clouds, hot spots, and carbon chemistry

To figure out what could be causing the variability on SIMP 0136, the team used atmospheric models to show where in the atmosphere each wavelength of light was originating.

“Different wavelengths provide information about different depths in the atmosphere,” explained McCarthy. “We started to realize that the wavelengths that had the most similar light-curve shapes also probed the same depths, which reinforced this idea that they must be caused by the same mechanism.”

One group of wavelengths, for example, originates deep in the atmosphere where there could be patchy clouds made of iron particles. A second group comes from higher clouds thought to be made of tiny grains of silicate minerals. The variations in both of these light curves are related to patchiness of the cloud layers.

A third group of wavelengths originates at very high altitude, far above the clouds, and seems to track temperature. Bright “hot spots” could be related to auroras that were previously detected at radio wavelengths, or to upwelling of hot gas from deeper in the atmosphere.

Some of the light curves cannot be explained by either clouds or temperature, but instead show variations related to atmospheric carbon chemistry. There could be pockets of carbon monoxide and carbon dioxide rotating in and out of view, or chemical reactions causing the atmosphere to change.

“We haven’t really figured out the chemistry part of the puzzle yet,” said Vos. “But these results are really exciting because they are showing us that the abundances of molecules like methane and carbon dioxide could change from place to place and over time. If we are looking at an exoplanet and can get only one measurement, we need to consider that it might not be representative of the entire planet.”

This research was conducted as part of Webb’s General Observer (GO) Program 3548.

Bibliographic information:

Allison M. McCarthy et al 2025, ApJL 981 L22, DOI: 10.3847/2041-8213/ad9eaf

The graphic has two parts. On the left are light curves showing the change in brightness of three sets of near-infrared wavelengths over time. On the right is a cross-section of the object’s atmosphere, showing the altitude that each set of wavelengths originates and their relationship to cloud layers or temperature.
These light curves show the change in brightness of three different sets of wavelengths (colors) of near-infrared light coming from the isolated planetary-mass object SIMP 0136 as it rotated. The light was captured by Webb’s NIRSpec (Near-Infrared Spectrograph), which collected a total of 5,726 spectra — one every 1.8 seconds — over the course of about 3 hours on 23 July 2023 (SIMP 0136 completes one rotation every 2.4 hours).
By comparing these light curves to models, researchers were able to show that each set of wavelengths probes different depths (pressures) in the atmosphere.
The curve shown in red tracks the brightness of 0.9- to 1.4-micron light thought to originate deep in the atmosphere at a pressure of about 10 bars (about 10 times the air pressure at sea level on Earth), within clouds made of iron particles. The curve shown in yellow tracks the brightness of 1.4- to 2.3-micron light from a pressure of about 1 bar within higher clouds made of tiny grains of silicate minerals. The variations in brightness shown by these two curves is related to patchiness of the cloud layers, which emit some wavelengths of light and absorb others.
The curve shown in blue tracks the brightness of 3.3- to 3.6-micron light that originates high above the clouds at a pressure of about 0.1 bars. Changes in brightness of these wavelengths are related to variations in temperature around the object. Bright “hot spots” could be related to auroras that have been detected at radio wavelengths, or to upwelling of hot gas from deeper in the atmosphere.
The differences in shape of these three light curves show that there are complex variations in SIMP 0136’s atmosphere with depth as well as longitude. If the atmosphere varied around the object in the same way at all depths, the light curves would have similar patterns. If it varied with depth, but not longitude, the light curves would be straight, flat lines.
Note this graph shows the relative change in brightness for each given set of wavelengths over time, not the difference in absolute brightness between the different sets. At any given time, there is more light coming from the deep atmosphere (red light curve) than from the upper atmosphere (blue light curve).
SIMP 0136 is located within the Milky Way, about 20 light-years from Earth, in the constellation Pisces. It is the brightest isolated planet or brown dwarf visible from the Northern Hemisphere, and is thought to be about 200 million years old. The artist’s concepts are based on spectroscopic observations. Webb has not captured a direct image of the object.
Credit: NASA, ESA, CSA, J. Olmsted (STScI)

Press release from ESA Webb.

Hubble celebrates a decade of tracking the outer planets

From 2014 to 2024, the NASA/ESA Hubble Space Telescope has been studying the outer planets under a program called OPAL (Outer Planet Atmospheres Legacy) to obtain long-time baseline observations of Jupiter, Saturn, Uranus, and Neptune in order to understand their atmospheric dynamics and evolution. Hubble is the only telescope that can provide high spatial resolution and image stability for global studies of cloud coloration, activity, and atmospheric motion on a consistent time basis to help constrain the underlying mechanics of weather and climate systems.

All four of the outer planets have deep atmospheres and no solid surfaces. Their churning atmospheres have their own unique weather systems, some with colorful bands of multicolored clouds, and with mysterious, large storms that pop up or linger for many years. Each also has seasons lasting many years as they revolve around the Sun.

Following the complex behavior is akin to understanding Earth’s dynamic weather as followed over many years, as well as the Sun’s influence on the solar system’s weather. The four wonder-worlds also serve as proxies for understanding the weather and climate on similar planets orbiting other stars.

Planetary scientists realized that any one year of data from Hubble, while interesting in its own right, doesn’t tell you the full story on the outer planets. Hubble’s OPAL program has routinely visited the planets once a year when they are closest to the Earth, an alignment called opposition. This has yielded a huge archive of data that has led to a string of remarkable discoveries to share with planetary astronomers around the world.

Highlights of the OPAL team’s decade of discovery is provided below.

Jupiter

Jupiter’s bands of clouds present an ever-changing kaleidoscope of shapes and colors. There is always stormy weather on Jupiter: cyclones, anticyclones, wind shear, and the largest storm in the solar system, the Great Red Spot (GRS). Jupiter is covered with largely ammonia ice-crystal clouds on top of an atmosphere that’s tens of thousands of miles deep.

Hubble’s sharp images track clouds and measure the winds, storms, and vortices, in addition to monitoring the size, shape and behavior of the GRS. Hubble follows as the GRS continues shrinking in size, but is still large enough to swallow Earth. OPAL data recently measured how often mysterious dark ovals—visible only at ultraviolet wavelengths—appeared in the “polar hoods” of stratospheric haze. Unlike Earth, Jupiter is only inclined three degrees on its axis (Earth is 23.5 degrees). Seasonal changes might not be expected, except that Jupiter’s distance from the Sun varies by roughly 64 million kilometres over its 12-year-long orbit, and so OPAL closely monitors the atmosphere for seasonal effects. Another Hubble advantage is that ground-based observatories can’t continuously view Jupiter for two Jupiter rotations, because that adds up to 20 hours. During that time, an observatory on the ground would have gone into daytime and Jupiter would no longer be visible until the next evening.

A two-panel image labeled “Jupiter, January 5, 2024, HST WFC3/UVIS” showcases the wealth of information provided by the spectral filters on the Hubble’s Wide Field Camera 3 (WFC3) science instrument. At left, this Hubble image of Jupiter is created using three filters at wavelengths similar to the colors seen by the human eye: F395N is blue, F502N is green, F658N is red. At right, the wavelength bounds are widened beyond the visible range to extend just into the ultraviolet (UV) and infrared regimes: F343N is blue, F467M is green, FQ889N is red. Humans can’t perceive these extended wavelengths. The result is a vivid disk that shows UV-absorbing lofty hazes as orange (over the poles and in three large storms, including the Great Red Spot), and freshely-formed ice as white (compact storm plumes just north of the equator). These filters (and others not shown here) allow astronomers to study differences in cloud thickness, altitude, and chemical makeup.
Two views of Jupiter showcase the wealth of information provided by the spectral filters on the Hubble Space Telescope’s Wide Field Camera 3 (WFC3) science instrument. At left, the RGB composite is created using three filters at wavelengths similar to the colors seen by the human eye. At right, the wavelength bounds are widened beyond the visible range to extend just into the ultraviolet (UV) and infrared regimes. Humans cannot perceive these extended wavelengths, but some animals are able to detect infrared and ultraviolet light. The result is a vivid disk that shows UV-absorbing lofty hazes as orange (over the poles and in three large storms, including the Great Red Spot), and freshly-formed ice as white (compact storm plumes just north of the equator). Astronomers, including the OPAL team, use these filters (and others not shown here) to study differences in cloud thickness, altitude, and chemical makeup.
Credit: NASA, ESA, A. Simon (NASA/GSFC), M. Wong (UC Berkeley), J. DePasquale (STScI)

OPAL’s findings may also support ESA’s Jupiter Icy Moons Explorer, Juice, which was launched on 14 April 2023. Juice will make detailed observations of Jupiter and its three large ocean-bearing moons — Ganymede, Callisto and Europa — with a suite of remote sensing, geophysical and in situ instruments. The mission will characterise these moons as both planetary objects and possible habitats, explore Jupiter’s complex environment in depth, and study the wider Jupiter system as an archetype for gas giants across the Universe.

A nine-panel collage showing Hubble images of Jupiter taken under the OPAL (Outer Planet Atmospheres Legacy) program from 2015-2024, with approximately true color. OPAL tracks the Great Red Spot (GRS) and other notable changes in Jupiter’s banded cloud structure of zones and belts over time.Credit:
NASA, ESA, A. Simon (GSFC), M. Wong (UC Berkeley), J. DePasquale (STScI)
A nine-panel collage showing Hubble images of Jupiter taken under the OPAL (Outer Planet Atmospheres Legacy) program from 2015-2024, with approximately true color. OPAL tracks the Great Red Spot (GRS) and other notable changes in Jupiter’s banded cloud structure of zones and belts over time.
Credit:
NASA, ESA, A. Simon (GSFC), M. Wong (UC Berkeley), J. DePasquale (STScI)

Saturn

Saturn takes more than 29 years to orbit the Sun, and so OPAL has followed it for approximately one quarter of a Saturnian year (picking up in 2018, after the end of the Cassini mission). Because Saturn is tilted 26.7 degrees, it goes through more profound seasonal changes than Jupiter. Saturnian seasons last approximately seven years. This also means Hubble can view the spectacular ring system from an oblique angle of almost 30 degrees to see the rings tilted edge-on. Edge-on, the rings nearly vanish because they are relatively paper-thin. This will happen again in 2025.

OPAL has followed changes in colors of Saturn’s atmosphere. The varying color was first detected by the Cassini orbiter, but Hubble provides a longer baseline. Hubble revealed slight changes from year-to-year in color, possibly caused by cloud height and winds. The observed changes are subtle because OPAL has covered only a fraction of a Saturnian year. Major changes happen when Saturn progresses into the next season.

Saturn’s mysteriously dark ring spokes, which slice across the ring plane, are transient features that rotate along with the rings. Their ghostly appearance only persists for two or three rotations around Saturn. During active periods, freshly formed spokes continuously add to the pattern. They were first seen in 1981 by Voyager 2. Cassini also saw the spokes during its 13-year-long mission, which ended in 2017. Hubble shows that the frequency of spoke apparitions is seasonally driven, first appearing in OPAL data in 2021. Long-term monitoring shows that both the number and contrast of the spokes vary with Saturn’s seasons.

A six-panel collage titled “Saturn, August 22, 2024, HST WFC3/UVIS.” This “Warhol-esque” array of Saturn images depict real data from multiple filters mapped onto the RGB colors perceptible to the human eye. Each filter combination emphasizes subtle differences in cloud altitude or composition. Infrared spectra from the Cassini mission suggested that Saturn’s aerosol particles may have even more complex chemical diversity than on Jupiter. The OPAL (Outer Planet Atmospheres Legacy) program extends Cassini’s legacy by measuring how the subtle patterns in the clouds vary over time.
n array of Saturn images depict real data from multiple filters mapped onto the RGB colors perceptible to the human eye. Each filter combination emphasizes the subtle differences in cloud altitude or composition. Infrared spectra from the Cassini mission suggested that Saturn’s aerosol particles may have even more complex chemical diversity than on Jupiter.
Credit: NASA, ESA, A. Simon (NASA/GSFC), M. Wong (UC Berkeley), J. DePasquale (STScI)

Uranus

Uranus is tilted on its side so that its spin axis almost lies in the plane of the planet’s orbit. This results in the planet going through radical seasonal changes along its 84-year-long trek around the Sun. The consequence of the planet’s tilt means part of one hemisphere is completely without sunlight, for stretches of time lasting up to 42 years. OPAL has followed the northern pole now tipping toward the Sun.

With OPAL, Hubble first imaged Uranus after the spring equinox, when the Sun was last shining directly over the planet’s equator. Hubble resolved multiple storms with methane ice-crystal clouds appearing at mid-northern latitudes as summer approaches the north pole. Uranus’ north pole now has a thickened photochemical haze with several little storms near the edge of the boundary. Hubble has been tracking the size of the north polar cap and it continues to get brighter year after year. As the northern summer solstice approaches in 2028, the cap may grow brighter still, and will be aimed directly toward Earth, allowing good views of the rings and north pole. The ring system will then appear face-on.

Neptune

When Voyager 2 flew by Neptune 1989, astronomers were mystified by a great dark spot the size of the Atlantic Ocean looming in the atmosphere. Was it long-lived like Jupiter’s Great Red Spot? The question remained unanswered until Hubble was able to show in 1994 that such dark storms were transitory, cropping up and then disappearing over a duration of two to six years each. During the OPAL program, Hubble saw the end of one dark spot and the full life cycle of a second one – both of them migrating toward the equator before dissipating. The OPAL program ensures that astronomers won’t miss another one.

Hubble observations uncovered a link between Neptune’s shifting cloud abundance and the 11-year solar cycle. The connection between Neptune and solar activity is surprising to planetary scientists because Neptune is our solar system’s farthest major planet. It receives sunlight with about 0.1% of the intensity Earth receives. Yet Neptune’s global cloudy weather seems to be influenced by solar activity. Do the planet’s four seasons (each lasting approximately 40 years) also play a role? We may find out, if the OPAL program continues running on Hubble until the year 2179!

A montage of Hubble Space Telescope images of our solar system’s four giant outer planets: Jupiter, Saturn, Uranus, and Neptune, taken under the OPAL (Outer Planet Atmospheres Legacy) program over a duration of 10 years, from 2014 to 2024.
This is a montage of NASA/ESA Hubble Space Telescope views of our solar system’s four giant outer planets: Jupiter, Saturn, Uranus, and Neptune, each shown in enhanced color. The images were taken over nearly 10 years, from 2014 to 2024. This long baseline allows astronomers to track seasonal changes in each planet’s turbulent atmosphere, with the sharpness of the NASA planetary flyby probes of the 1980s. These images were taken under a program called OPAL (Outer Planet Atmospheres Legacy).
From upper-left toward center, the hazy white polar cap on the three teal-colored Uranus images appears more face-on as the planet approaches northern summer.
From center-right to far-center right, three images of the blue planet Neptune show the coming and going of clouds as the Sun’s radiation level changes. Several of Neptune’s mysterious dark spots have come and gone sequentially over OPAL’s decade of observations.
Seven views of yellow-brown Saturn stretch across the center of the mosaic in a triangle—one for each year of OPAL observations—showing the tilt of the angle of the ring plane relative to the view from Earth. Approximately every 15 years the relatively paper-thin rings (about one mile thick) can be seen edge-on. In 2018 they were near their maximum tilt toward Earth. Colorful changes in Saturn’s bands of clouds can be followed as the weather changes.
At bottom center, three images of Jupiter spanning nearly a decade, form a triangle. There are notable changes in Jupiter’s banded cloud structure of zones and belts. OPAL measured shrinking of the legendary Great Red Spot, while its rotation period speeds up.
Credit: NASA, ESA, A. Simon (NASA-GSFC), M. H. Wong (UC Berkeley), J. DePasquale (STScI)

Press release from ESA Hubble.

Hubble’s new observations of Jupiter’s Great Red Spot, collected over 90 days between December 2023 to March 2024

Astronomers have observed Jupiter’s legendary Great Red Spot (GRS), an anticyclone large enough to swallow Earth, for at least 150 years. But there are always new surprises – especially when the NASA/ESA Hubble Space Telescope takes a close-up look at it.

Eight Hubble images showing Jupiter’s Great Red Spot. The GRS appears as a bright red oval in the middle of cream-coloured cloud bands. The images trace changes in the GRS’s size, shape, brightness, colour, and twisting, over a period of 90 days between December 2023 and March 2024.
Using Hubble Space Telescope data spanning approximately 90 days (between December 2023 and March 2024) when the giant planet Jupiter was approximately 740 million kilometres from the Sun, astronomers measured the Great Red Spot’s size, shape, brightness, colour, and vorticity over one full oscillation cycle. The data reveal that the Great Red Spot is not as stable as it might look. It was observed going through an oscillation in its elliptical shape, jiggling like a bowl of gelatin. The cause of the 90-day oscillation is unknown.
Credit: NASA, ESA, A. Simon (GSFC)

Hubble’s new observations of the famous red storm, collected over 90 days between December 2023 to March 2024, reveal that the GRS is not as stable as it might look. The recent data show the GRS jiggling like a bowl of gelatin. The combined Hubble images allowed astronomers to assemble a time-lapse movie of the squiggly behaviour of the GRS.

“While we knew its motion varies slightly in its longitude, we didn’t expect to see the size oscillate. As far as we know, it’s not been identified before,” said Amy Simon of NASA’s Goddard Space Flight Center in Greenbelt, Maryland. “This is really the first time we’ve had the proper imaging cadence of the GRS. With Hubble’s high resolution we can say that the GRS is definitively squeezing in and out at the same time as it moves faster and slower. That was very unexpected, and at present there are no hydrodynamic explanations.”

Hubble monitors Jupiter and the other outer solar system planets every year through the Outer Planet Atmospheres Legacy program (OPAL) led by Simon, but these observations were from a program dedicated to the GRS. Understanding the mechanisms of the largest storms in the solar system puts the theory of hurricanes on Earth into a broader cosmic context, which might be applied to better understanding the meteorology on planets around other stars.

Eight images of the giant planet Jupiter spanning approximately 90 days between December 2023 and March 2024. The planet appears striped, with brown and white horizontal bands of clouds. These stripes are called belts (sinking air) and bands (rising air). The polar regions appear more mottled.
Using Hubble Space Telescope data spanning approximately 90 days (between December 2023 and March 2024) when the giant planet Jupiter was approximately 740 million kilometres from the Sun, astronomers measured the Great Red Spot’s size, shape, brightness, colour, and vorticity over a full oscillation cycle. The data reveal that the Great Red Spot is not as stable as it might look. It was observed going through an oscillation in its elliptical shape, jiggling like a bowl of gelatin. The cause of the 90-day oscillation is unknown. The observation is part of the Outer Planet Atmospheres Legacy program (OPAL).
Credit: NASA, ESA, A. Simon (GSFC)

Simon’s team used Hubble to zoom in on the GRS for a detailed look at its size, shape, and any subtle colour changes.

“When we look closely, we see a lot of things are changing from day to day,” said Simon.

This includes ultraviolet-light observations showing that the distinct core of the storm gets brightest when the GRS is at its largest size in its oscillation cycle. This indicates less haze absorption in the upper atmosphere.

“As it accelerates and decelerates, the GRS is pushing against the windy jet streams to the north and south of it,” said co-investigator Mike Wong of the University of California at Berkeley. “It’s similar to a sandwich where the slices of bread are forced to bulge out when there’s too much filling in the middle.” 

Wong contrasted this to Neptune, where dark spots can drift wildly in latitude without strong jet streams to hold them in place. Jupiter’s Great Red Spot has been held at a southern latitude, trapped between the jet streams, for the extent of Earth-bound telescopic observations.

The team has continued watching the GRS shrink since the OPAL program began 10 years ago. They predict it will keep shrinking before taking on a stable, less-elongated, shape. 

“Right now it’s over-filling its latitude band relative to the wind field. Once it shrinks inside that band the winds will really be holding it in place,” said Simon.

The team predicts that the GRS will probably stabilise in size, but for now Hubble only observed it for one oscillation cycle.

“This is a great example of the power of Hubble’s exquisite imaging for monitoring of the atmospheres of the outer planets,” said co-investigator Patrick Irwin of the University of Oxford. “With these new observations we were able to study the dynamics and evolution of the GRS over three months, building on our understanding of the long-term properties of Jupiter obtained from the OPAL program over the past decade.”

The researchers hope that in the future other high-resolution images from Hubble might identify other Jovian parameters that indicate the underlying cause of the oscillation.


Press release from ESA Hubble

Astronomers find surprising shapes in Jupiter’s upper atmosphere, above the Great Red Spot

Using the NASA/ESA/CSA James Webb Space Telescope, scientists observed the region above Jupiter’s iconic Great Red Spot to discover a variety of previously unseen features. The region, previously believed to be unremarkable in nature, hosts a variety of intricate structures and activity.

A image of a small area of Jupiter’s atmosphere, shaped like a jagged rectangle. The image is fuzzy and ranges from red to blue in colours, where bluer colours show lower altitudes in Jupiter’s atmosphere, and redder colours show higher altitudes. The image is centred on the Great Red Spot, which stands out as a blue circle.
New observations of the Great Red Spot on Jupiter have revealed that the planet’s atmosphere above and around the infamous storm is surprisingly interesting and active. This image shows the region observed by Webb’s Near-InfraRed Spectrograph (NIRSpec). It is stitched together from six NIRSpec Integral Field Unit images taken in July 2022, each around 300 square kilometres.
The NIRSpec observations show infrared light emitted by hydrogen molecules in Jupiter’s ionosphere. These molecules lie over 300 kilometres above the clouds of the storm, where light from the Sun ionises the hydrogen and stimulates this infrared emission. In this image, redder colours display the hydrogen emission from these high altitudes in the planet’s ionosphere. Bluer colours show infrared light from lower altitudes, including cloud-tops in the atmosphere and the very prominent Great Red Spot.
Jupiter is distant from the Sun and therefore receives a uniform, low level of daylight, meaning that most of the planet’s surface is relatively dim at these infrared wavelengths — especially compared to the emission from molecules near the poles, where Jupiter’s magnetic field is especially strong. Contrary to the researchers’ expectations that this area would therefore look homogeneous in nature, it hosts a variety of intricate structures, including dark arcs and bright spots, across the entire field of view.
Credit: Credit: ESA/Webb, NASA & CSA, H. Melin, M. Zamani (ESA/Webb)

Jupiter is one of the brightest objects in the night sky, and it is easily seen on a clear night. Aside from the bright northern and southern lights at the planet’s polar regions, the glow from Jupiter’s upper atmosphere is weak and is therefore challenging for ground-based telescopes to discern details in this region. However, Webb’s infrared sensitivity allows scientists to study Jupiter’s upper atmosphere above the infamous Great Red Spot with unprecedented detail.

The upper atmosphere of Jupiter is the interface between the planet’s magnetic field and the underlying atmosphere. Here, the bright and vibrant displays of northern and southern lights can be seen, which are fuelled by the volcanic material ejected from Jupiter’s moon Io. However, closer to the equator, the structure of the planet’s upper atmosphere is influenced by incoming sunlight. Because Jupiter receives only 4% of the sunlight that is received on Earth, astronomers predicted this region to be homogeneous in nature.

A graphic with two panels. The left side is an infrared image of the planet Jupiter, labelled “Webb/NIRCam”. The planet is shown in multiple colours, especially at the poles, and on the Great Red Spot, visible as a circular storm at the planet’s bottom-right. The Spot is surrounded by a jagged rectangle highlight. The right side shows a close-in image of that area in different colours, labelled “Webb/NIRSpec”. A coloured bar shows that bluer colours on this side show lower altitudes in Jupiter’s atmosphere, and redder colours show higher altitudes.
New observations of the Great Red Spot on Jupiter have revealed that the planet’s atmosphere above and around the infamous storm is surprisingly interesting and active. This graphic shows the region observed by Webb — first its location on a NIRCam image of the whole planet (left), and the region itself (right), imaged by Webb’s Near-InfraRed Spectrograph (NIRSpec).
The NIRSpec image is stitched together from six NIRSpec Integral Field Unit images taken in July 2022, each around 300 square kilometres, and shows infrared light emitted by hydrogen molecules in Jupiter’s ionosphere. These molecules lie over 300 kilometres above the clouds of the storm, where light from the Sun ionises the hydrogen and stimulates this infrared emission. In this image, redder colours display the hydrogen emission from these high altitudes in the planet’s ionosphere. Bluer colours show infrared light from lower altitudes, including cloud-tops in the atmosphere and the very prominent Great Red Spot.
Jupiter is distant from the Sun and therefore receives a uniform, low level of daylight, meaning that most of the planet’s surface is relatively dim at these infrared wavelengths — especially compared to the emission from molecules near the poles, where Jupiter’s magnetic field is especially strong. Contrary to the researchers’ expectations that this area would therefore look homogeneous in nature, it hosts a variety of intricate structures, including dark arcs and bright spots, across the entire field of view.
Credit: ESA/Webb, NASA & CSA, Jupiter ERS Team, J. Schmidt, H. Melin, M. Zamani (ESA/Webb)

The Great Red Spot of Jupiter was observed by Webb’s Near-InfraRed Spectrograph (NIRSpec) in July 2022, using the instrument’s Integral Field Unit capabilities. The team’s Early Release Science observations sought to investigate if this region was in fact dull, and the region above the iconic Great Red Spot was targeted for Webb’s observations. The team was surprised to discover that the upper atmosphere hosts a variety of intricate structures, including dark arcs and bright spots, across the entire field of view.

We thought this region, perhaps naively, would be really boring,” shared team leader Henrik Melin of the University of Leicester in the United Kingdom. “It is in fact just as interesting as the northern lights, if not more so. Jupiter never ceases to surprise.”

Although the light emitted from this region is driven by sunlight, the team suggests there must be another mechanism altering the shape and structure of the upper atmosphere.

“One way in which you can change this structure is by gravity waves – similar to waves crashing on a beach, creating ripples in the sand,” explained Melin. “These waves are generated deep in the turbulent lower atmosphere, all around the Great Red Spot, and they can travel up in altitude, changing the structure and emissions of the upper atmosphere.”

The team explains that these atmospheric waves can be observed on Earth on occasion, however they are much weaker than those observed on Jupiter by Webb. They also hope to conduct follow-up Webb observations of these intricate wave patterns in the future to investigate how the patterns move within the planet’s upper atmosphere and to develop our understanding of the energy budget of this region and how the features change over time.

These findings may also support ESA’s Jupiter Icy Moons Explorer, Juice, which was launched on 14 April 2023. Juice will make detailed observations of Jupiter and its three large ocean-bearing moons — Ganymede, Callisto and Europa — with a suite of remote sensing, geophysical and in situ instruments. The mission will characterise these moons as both planetary objects and possible habitats, explore Jupiter’s complex environment in depth, and study the wider Jupiter system as an archetype for gas giants across the Universe.

These observations were taken as part of the Early Release Science programme #1373ERS Observations of the Jovian System as a Demonstration of JWST’s Capabilities for Solar System Science (Co-PIs: I. de Pater, T. Fouchet).

“This ERS proposal was written back in 2017,” shared team member Imke de Pater of the University of California, Berkeley. “One of our objectives had been to investigate why the temperature above the Great Red Spot appeared to be high, as at the time recent observations with the NASA Infrared Telescope Facility had revealed. However, our new data showed very different results.”

These results have been published in Nature Astronomy.


Press release from ESA Webb

Hubble tracks the stormy weather on Jupiter


The giant planet Jupiter, in all its banded glory, is revisited by the NASA/ESA Hubble Space Telescope in these latest images, taken on 5–6 January 2024, that capture both sides of the planet. Hubble monitors Jupiter and the other outer Solar System planets every year under the Outer Planet Atmospheres Legacy programme (OPAL). This is because these large worlds are shrouded in clouds and hazes stirred up by violent winds, leading to a kaleidoscope of ever-changing weather patterns.

The largest and nearest of the giant outer planets, Jupiter’s colourful clouds present an ever-changing kaleidoscope of shapes and colours. This is a planet where there is always stormy weather: cyclones, anticyclones, wind shear, and the largest storm in the Solar System, the Great Red Spot. Jupiter has no solid surface and is perpetually covered with largely ammonia ice-crystal clouds that are only about 48 kilometres thick in an atmosphere that’s tens of thousands of kilometres deep and give the planet its banded appearance. The bands are produced by air flowing in different directions at various latitudes with speeds approaching 560 kilometres per hour. Lighter-hued areas where the atmosphere rises are called zones. Darker regions where air falls are called belts. When these opposing flows interact, storms and turbulence appear. Hubble tracks these dynamic changes every year with unprecedented clarity, and there are always surprises. The many large storms and small white clouds seen in Hubble’s latest images are evidence for a lot of activity going on in Jupiter’s atmosphere right now.


Press release from ESA Hubble.

Webb finds carbon source on surface of Jupiter’s moon Europa

Jupiter’s moon Europa is one of a handful of worlds in our Solar System that could potentially harbour conditions suitable for life. Previous research has shown that beneath its water-ice crust lies a salty ocean of liquid water with a rocky seafloor. However, planetary scientists had not confirmed whether or not that ocean contained the chemicals needed for life, particularly carbon.

Europa (NIRCam image)
Webb’s NIRCam (Near Infrared Camera) captured this picture of the surface of Jupiter’s moon Europa. Webb identified carbon dioxide on the icy surface of Europa that likely originated in the moon’s subsurface ocean. This discovery has important implications for the potential habitability of Europa’s ocean. The moon appears mostly blue because it is brighter at shorter infrared wavelengths. The white features correspond with the chaos terrain Powys Regio (left) and Tara Regio (centre and right), which show enhanced carbon dioxide ice on the surface.
Credit:
NASA, ESA, CSA, G. Villanueva (NASA/GSFC), S. Trumbo (Cornell Univ.), A. Pagan (STScI)

Astronomers using data from the NASA/ESA/CSA James Webb Space Telescope have identified carbon dioxide in a specific region on the icy surface of Europa. Analysis indicates that this carbon likely originated in the subsurface ocean and was not delivered by meteorites or other external sources. Moreover, it was deposited on a geologically recent timescale. This discovery has important implications for the potential habitability of Europa’s ocean.

On Earth, life likes chemical diversity — the more diversity, the better. We’re carbon-based life. Understanding the chemistry of Europa’s ocean will help us determine whether it’s hostile to life as we know it, or whether it might be a good place for life,

said Geronimo Villanueva of NASA’s Goddard Space Flight Center in Greenbelt, Maryland, lead author of one of two independent papers describing the findings.

We now think that we have observational evidence that the carbon we see on Europa’s surface came from the ocean. That’s not a trivial thing. Carbon is a biologically essential element,

added Samantha Trumbo of Cornell University in Ithaca, New York, lead author of the second paper analysing this data.

NASA plans to launch its Europa Clipper spacecraft, which will perform dozens of close flybys of Europa to further investigate whether it could have conditions suitable for life, in October 2024.

A Surface-Ocean Connection

Webb finds that on Europa’s surface, carbon dioxide is most abundant in a region called Tara Regio — a geologically young area of generally resurfaced terrain known as ‘chaos terrain’. The surface ice has been disrupted, and there has likely been an exchange of material between the subsurface ocean and the icy surface.

Previous observations from the Hubble Space Telescope show evidence for ocean-derived salt in Tara Regio,” explained Trumbo. “Now we’re seeing that carbon dioxide is heavily concentrated there as well. We think this implies that the carbon probably has its ultimate origin in the internal ocean.

Scientists are debating to what extent Europa’s ocean connects to its surface. I think that question has been a big driver of Europa exploration,” said Villanueva. “This suggests that we may be able to learn some basic things about the ocean’s composition even before we drill through the ice to get the full picture.

Both teams identified the carbon dioxide using data from the integral field unit of Webb’s Near-Infrared Spectrograph (NIRSpec). This instrument mode provides spectra with a resolution of 320 x 320 kilometres over a field of view of diameter 3128 kilometres on the surface of Europa, allowing astronomers to determine where specific chemicals are located.

Map of Europa's surface
This graphic shows a map of Europa’s surface with NIRCam (Near Infrared Camera) in the first panel and compositional maps derived from NIRSpec/IFU (Near Infrared Spectrograph’s Integral Field Unit) data in the following three panels. In the compositional maps, the white pixels correspond to carbon dioxide in the large-scale region of disrupted chaos terrain known as Tara Regio (centre and right), with additional concentrations within portions of the chaos region Powys Regio (left). The second and third panels show evidence of crystalline carbon dioxide, while the fourth panel indicates a complexed and amorphous form of carbon dioxide.
Astronomers using Webb have found carbon on the chaos terrain of Tara Regio and Powys Regio. Surface ices in these regions have been disrupted, and there has likely been a relatively recent exchange of material between the subsurface ocean and the icy surface. Carbon, a universal building block for life as we know it, likely originated in Europa’s ocean. The discovery suggests a potentially habitable environment in the salty subsurface ocean of Europa.
The NIRSpec/IFU images appear pixelated because Europa is 10 x 10 pixels across in the detector’s field of view.
Credit:
NASA, ESA, CSA, G. Villanueva (NASA/GSFC), S. Trumbo (Cornell Univ.), A. Pagan (STScI)

Carbon dioxide isn’t stable on Europa’s surface. Therefore, the scientists say it’s likely that it was supplied on a geologically recent timescale — a conclusion bolstered by its concentration in a region of young terrain.

These observations only took a few minutes of the observatory’s time,

said Heidi Hammel of the Association of Universities for Research in Astronomy, a Webb interdisciplinary scientist leading Webb’s Cycle 1 Guaranteed Time Observations of the Solar System.

Even in this short period of time, we were able to do really big science. This work gives a first hint of all the amazing Solar System science we’ll be able to do with Webb.”

Searching for a Plume

Villanueva’s team also looked for evidence of a plume of water vapour erupting from Europa’s surface. Researchers using the NASA/ESA Hubble Space Telescope reported tentative detections of plumes in 2013, 2016, and 2017. However, finding definitive proof has been difficult.

The new Webb data show no evidence of plume activity, which allowed Villanueva’s team to set a strict upper limit on the rate at which material is potentially being ejected. The team stressed, however, that their non-detection does not rule out a plume.

There is always a possibility that these plumes are variable and that you can only see them at certain times. All we can say with 100% confidence is that we did not detect a plume at Europa when we made these observations with Webb,” said Hammel.

These findings may help inform NASA’s Europa Clipper mission, as well as ESA’s Jupiter Icy Moons Explorer, Juice, which was launched on 14 April 2023. Juice will make detailed observations of the giant gas planet and its three large ocean-bearing moons — Ganymede, Callisto and Europa — with a suite of remote sensing, geophysical and in situ instruments. The mission will characterise these moons as both planetary objects and possible habitats, explore Jupiter’s complex environment in depth, and study the wider Jupiter system as an archetype for gas giants across the Universe.

This is a great first result of what Webb will bring to the study of Jupiter’s moons,” said co-author Guillaume Cruz-Mermy, formerly of Université Paris-Saclay and current ESA Research Fellow at the European Space Astronomy Centre. “I’m looking forward to seeing what else we can learn about their surface properties from these and future observations.

The two papers associated with this research will be published in Science on 21 September 2023.

Europa (NIRCam image, cropped)
Webb’s NIRCam (Near Infrared Camera) captured this picture of the surface of Jupiter’s moon Europa. Webb identified carbon dioxide on the icy surface of Europa that likely originated in the moon’s subsurface ocean. This discovery has important implications for the potential habitability of Europa’s ocean. The moon appears mostly blue because it is brighter at shorter infrared wavelengths. The white features correspond with the chaos terrain Powys Regio (left) and Tara Regio (centre and right), which show enhanced carbon dioxide ice on the surface.
Credit:
NASA, ESA, CSA, G. Villanueva (NASA/GSFC), S. Trumbo (Cornell Univ.), A. Pagan (STScI)


Press release from ESA Webb.

Hubble monitors changing weather and seasons on Jupiter and Uranus

Ever since its launch in 1990, the NASA/ESA Hubble Space Telescope has been an interplanetary weather observer, keeping an eye on the ever-changing atmospheres of the largely gaseous outer planets. And it’s an unblinking eye that allows Hubble’s sharpness and sensitivity to monitor a kaleidoscope of complex activities over time. Today new images are shared of Jupiter and Uranus.

Hubble monitors changing weather and seasons on Jupiter and Uranus
Hubble monitors changing weather and seasons on Jupiter and Uranus. Note: The planets do not appear in this image to scale. Credit:
NASA, ESA, STScI, A. Simon (NASA-GSFC), M. H. Wong (UC Berkeley), J. DePasquale (STScI)


The outer planets beyond Mars do not have solid surfaces to affect weather as on Earth. And sunlight is much less able to drive atmospheric circulation. Nevertheless, these are ever-changing worlds. And Hubble – in its role as interplanetary meteorologist – is keeping track, as it does every year. Jupiter’s weather is driven from the inside out, as more heat percolates up from its interior than it receives from the Sun. This heat indirectly drives colour-change cycles in the clouds, like the cycle that’s currently highlighting a system of alternating cyclones and anticyclones. Uranus has seasons that pass by at a snail’s pace because it takes 84 years to complete one orbit about the Sun. But those seasons are extreme, because Uranus is tipped on its side. As summer approaches in the northern hemisphere, Hubble sees a growing polar cap of high-altitude photochemical haze that looks similar to the smog over cities on Earth.

Inaugurated in 2014, the Hubble Space Telescope’s Outer Planet Atmospheres Legacy (OPAL) programme has been providing us with yearly views of the giant planets. Here are some recent images.

Jupiter

Credit:
NASA, ESA, STScI, A. Simon (NASA-GSFC), M. H. Wong (UC Berkeley), J. DePasquale (STScI)

The forecast for Jupiter is for stormy weather at low northern latitudes. A prominent string of alternating storms is visible, forming a ‘vortex street’ as some planetary astronomers call it. This is a wave pattern of nested cyclones and anticyclones, locked together like the alternating gears of a machine moving clockwise and counterclockwise. If the storms get close enough to each other and merge together, they could build an even larger storm, potentially rivalling the current size of the Great Red Spot. The staggered pattern of cyclones and anticyclones prevents individual storms from merging. Activity is also seen interior to these storms; in the 1990s Hubble didn’t see any cyclones or anticyclones with built-in thunderstorms, but these storms have sprung up in the last decade. Strong colour differences indicate that Hubble is seeing different cloud heights and depths as well.

The orange moon Io photobombs this view of Jupiter’s multicoloured cloud tops, casting a shadow toward the planet’s western limb. Hubble’s resolution is so sharp that it can see Io’s mottled-orange appearance, the result of its numerous active volcanoes. These volcanoes were first discovered when the Voyager 1 spacecraft flew by in 1979. The moon’s molten interior is overlaid by a thin crust through which the volcanoes eject material. Sulphur takes on various hues at different temperatures, which is why Io’s surface is so colourful. This image was taken on 12 November 2022.

Credit:
NASA, ESA, STScI, A. Simon (NASA-GSFC), M. H. Wong (UC Berkeley), J. DePasquale (STScI)

Jupiter’s legendary Great Red Spot takes centre stage in this view. Though this vortex is big enough to swallow Earth, it has actually shrunk to the smallest size it has ever been according to observation records dating back 150 years. Jupiter’s icy moon Ganymede can be seen transiting the giant planet at lower right. Slightly larger than the planet Mercury, Ganymede is the largest moon in the Solar System. It is a cratered world and has a mainly water-ice surface with apparent glacial flows driven by internal heat. This image was taken on 6 January 2023.

Jupiter and its large ocean-bearing moons (Ganymede, Callisto and Europa) are the target of ESA’s Jupiter Icy Moons Explorer (Juice). Preparations are currently underway to ready Juice for liftoff from Europe’s Spaceport in French Guiana on 13 April 2023 [1].

Uranus

Planetary oddball Uranus rolls around the Sun on its side as it follows its 84-year orbit, rather than spinning in a more ’vertical’ position as Earth does. Its weirdly tilted ‘horizontal’ rotation axis is angled just eight degrees off the plane of the planet’s orbit. One recent theory proposes that Uranus once had a massive moon that gravitationally destabilised it and then crashed into it. Other possibilities include giant impacts during the formation of the planets, or even giant planets exerting resonant torques on each other over time. The consequences of Uranus’s tilt are that for stretches of time lasting up to 42 years, parts of one hemisphere are completely without sunlight. When the Voyager 2 spacecraft visited during the 1980s, the planet’s south pole was pointed almost directly at the Sun. Hubble’s latest view shows the northern pole now tipping toward the Sun.

Credit:
NASA, ESA, STScI, A. Simon (NASA-GSFC), M. H. Wong (UC Berkeley), J. DePasquale (STScI)
Credit:
NASA, ESA, STScI, A. Simon (NASA-GSFC), M. H. Wong (UC Berkeley), J. DePasquale (STScI)

This is a Hubble view of Uranus taken in 2014, seven years after the northern spring equinox when the Sun was shining directly over the planet’s equator, and shows one of the first images from the OPAL programme. Multiple storms with methane ice-crystal clouds appear at mid-northern latitudes above the planet’s cyan-tinted lower atmosphere. Hubble imaged the ring system edge-on in 2007, but the rings are seen starting to open up seven years later in this view. At this time, the planet had multiple small storms and even some faint cloud bands.

As seen in 2022, Uranus’s north pole shows a thickened photochemical haze that looks similar to the smog over cities. Several little storms can be seen near the edge of the polar haze boundary. Hubble has been tracking the size and brightness of the north polar cap and it continues to get brighter year after year. Astronomers are disentangling multiple effects – from atmospheric circulation, particle properties, and chemical processes — that control how the atmospheric polar cap changes with the seasons. At the Uranian equinox in 2007, neither pole was particularly bright. As the northern summer solstice approaches in 2028 the cap may grow brighter still, and will be aimed directly toward Earth, allowing good views of the rings and the north pole; the ring system will then appear face-on. This image was taken on 10 November 2022.

Notes

[1] Ganymede is the main target of ESA’s Jupiter Icy Moons Explorer (Juice). As humanity’s next bold mission to the outer Solar System, Juice will complete numerous flybys around Ganymede, and eventually enter orbit around the moon. The mission will explore various key topics: Ganymede’s mysterious magnetic field, its hidden ocean, its complex core, its ice content and shell, its interactions with its local environment and that of Jupiter, its past and present activity, and whether or not the moon could be a habitable environment.

More information

The Hubble Space Telescope is a project of international cooperation between ESA and NASA.

The HST observations featured in this release include those from program 1679013937 , and 16995 (A. Simon).


Press release from ESA Hubble about the telescope observing the changing weather and seasons on Jupiter and Uranus.

Webb Detects Extremely Small Main-Belt Asteroid

A previously unknown 100–200-metre asteroid — roughly the size of Rome’s Colosseum — has been detected by an international team of European astronomers using the NASA/ESA/CSA James Webb Space Telescope. Their project used data from the calibration of the Mid-InfraRed Instrument (MIRI), in which the team serendipitously detected an interloping asteroid. The object is likely the smallest observed to date by Webb and may be an example of an object measuring under 1 kilometer in length within the main asteroid belt, located between Mars and Jupiter. More observations are needed to better characterize this object’s nature and properties.

small asteroid Webb
Webb Detects Extremely Small Main-Belt Asteroid. A previously unknown 100–200-metre asteroid — roughly the size of Rome’s Colosseum — has been detected by an international team of European astronomers using the NASA/ESA/CSA James Webb Space Telescope. Their project used data from the calibration of the Mid-InfraRed Instrument (MIRI), in which the team serendipitously detected an interloping asteroid. The object is likely the smallest observed to date by Webb and may be an example of an object measuring under 1 kilometer in length within the main asteroid belt, located between Mars and Jupiter. More observations are needed to better characterize this object’s nature and properties. Credits: N. Bartmann (ESA/Webb), ESO/M. Kornmesser and S. Brunier, N. Risinger (skysurvey.org)

The Solar System is teeming with asteroids and small rocky bodies — astronomers currently know of more than 1.1 million of these rocky remnants of the early days of the Solar System. The NASA/ESA/CSA James Webb Space Telescope’s ability to explore these objects at infrared wavelengths is expected to lead to groundbreaking new science, but a team of scientists have shown that Webb also has an unpredicted aptitude for serendipitously detecting small and previously unknown objects.

We — completely unexpectedly — detected a small asteroid in publicly available MIRI calibration observations,” explained Thomas Müller, an astronomer at the Max Planck Institute for Extraterrestrial Physics in Germany. “The measurements are some of the first MIRI measurements targeting the ecliptic plane and our work suggests that many, new objects will be detected with this instrument.

The Webb observations which revealed this small asteroid were not originally designed to hunt for new asteroids — in fact, they were calibration images of the main-belt asteroid (10920) 1998 BC1, which astronomers discovered in 1998 [1], but the calibration team considered them to have failed for technical reasons due to the brightness of the target and an offset telescope pointing. Despite this, the data on asteroid 10920 were used by the team to establish and test a new technique to constrain an object’s orbit and to estimate its size. The validity of the method was demonstrated for asteroid 10920 using the MIRI observations combined with data from ground-based telescopes and ESA’s Gaia mission [2].

In the course of the analysis of the MIRI data, the team found the smaller and previously unknown interloper in the same field of view. The team’s results suggest the object measures 100–200 meters, occupies a very low-inclination orbit, and was located in the inner main-belt region at the time of the Webb observations.

Our results show that even ‘failed’ Webb observations can be scientifically useful, if you have the right mindset and a little bit of luck,” elaborated Müller. “Our detection lies in the main asteroid belt, but Webb’s incredible sensitivity made it possible to see this roughly 100-metre object at a distance of more than 100 million kilometres.

The detection of this asteroid — which the team suspects to be the smallest observed to date by Webb and one of the smallest detected in the main-belt — would, if confirmed as a new asteroid discovery, have important implications for our understanding of the formation and evolution of the solar system. Current models predict the occurrence of asteroids down to very small sizes, but small asteroids have been studied in less detail than their larger counterparts owing to the difficulty of observing these objects. Future dedicated Webb observations will allow astronomers to study asteroids smaller than 1 kilometer in size, providing the necessary data to refine our models of the solar system’s formation.

What’s more, this result suggests that Webb will also be able to serendipitously contribute to the detection of new asteroids. The team suspect that even short MIRI observations close to the plane of the Solar System will always include a few asteroids, most of which will be unknown objects.

In order to confirm that the object detected is a newly discovered asteroid, more position data relative to background stars is required from follow-up studies to constrain the object’s orbit.

This is a fantastic result which highlights the capabilities of MIRI to serendipitously detect a previously undetectable size of asteroid in the main belt,” concluded Bryan Holler, Webb support scientist at the Space Telescope Science Institute in Baltimore, USA. “Repeats of these observations are in the process of being scheduled, and we are fully expecting new asteroid interlopers in those images!

Notes

[1] The main asteroid belt is a doughnut-shaped region which contains the majority of the Solar System’s asteroids. It lies roughly between the orbits of the planets Mars and Jupiter, and is closely aligned with the ecliptic plane, the plane of the Earth’s orbit around the Sun, which is also the rough plane in which the other planets of the Solar System lie.

[2] ESA’s Gaia mission is in the process of precisely measuring the positions of astronomical objects to build up an extraordinarily precise three-dimensional map of more than a thousand million stars.

Press release from ESA Webb on the small asteroid detected by the James Webb Space Telescope.

Hubble sees new atmosphere forming on a rocky exoplanet, GJ 1132 b

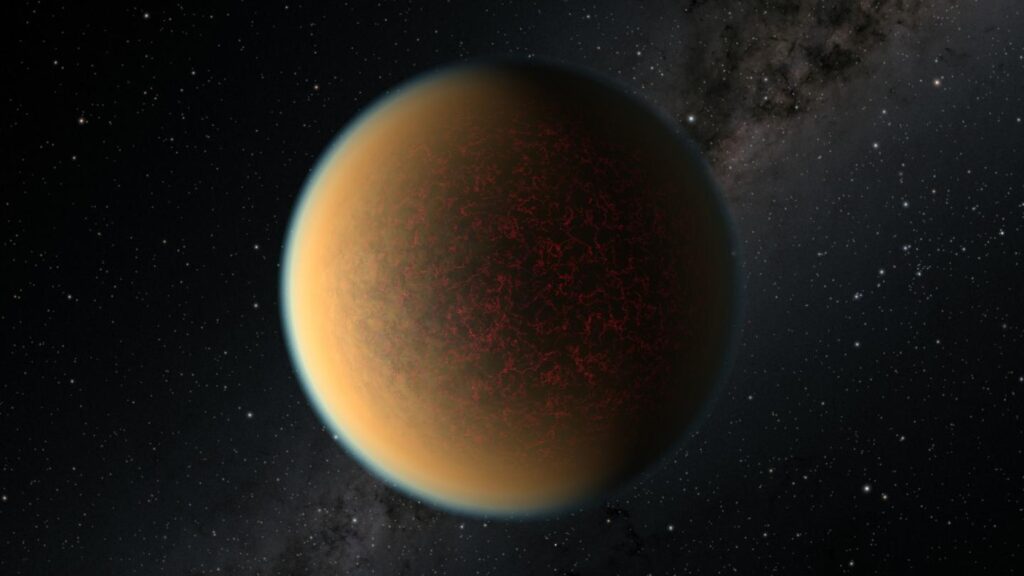
The planet GJ 1132 b appears to have begun life as a gaseous world with a thick blanket of atmosphere. Starting out at several times the radius of Earth, this so-called “sub-Neptune” quickly lost its primordial hydrogen and helium atmosphere, which was stripped away by the intense radiation from its hot, young star. In a short period of time, it was reduced to a bare core about the size of Earth.

GJ 1132 b
This image is an artist’s impression of the exoplanet GJ 1132 b. For the first time, scientists using the NASA/ESA Hubble Space Telescope have found evidence of volcanic activity reforming the atmosphere on this rocky planet, which has a similar density, size, and age to that of Earth. To the surprise of astronomers, new observations from Hubble have uncovered a second atmosphere that has replaced the planet’s first atmosphere. It is rich in hydrogen, hydrogen cyanide, methane and ammonia, and also has a hydrocarbon haze. Astronomers theorise that hydrogen from the original atmosphere was absorbed into the planet’s molten magma mantle and is now being slowly released by volcanism to form a new atmosphere. This second atmosphere, which continues to leak away into space, is continually being replenished from the reservoir of hydrogen in the mantle’s magma. Credit: NASA, ESA, and R. Hurt (IPAC/Caltech), CC BY 4.0

To the surprise of astronomers, new observations from Hubble [1] have uncovered a secondary atmosphere that has replaced the planet’s first atmosphere. It is rich in hydrogen, hydrogen cyanide, methane and ammonia, and also has a hydrocarbon haze. Astronomers theorise that hydrogen from the original atmosphere was absorbed into the planet’s molten magma mantle and is now being slowly released by volcanism to form a new atmosphere. This second atmosphere, which continues to leak away into space, is continually being replenished from the reservoir of hydrogen in the mantle’s magma.

“This second atmosphere comes from the surface and interior of the planet, and so it is a window onto the geology of another world,” explained team member Paul Rimmer of the University of Cambridge, UK. “A lot more work needs to be done to properly look through it, but the discovery of this window is of great importance.”

Pictured here is the region around the host star of the exoplanet GJ 1132 b. Credit:
ESA/Hubble, Digitized Sky Survey 2, CC BY 4.0.
Acknowledgement: Davide De Martin

“We first thought that these highly radiated planets would be pretty boring because we believed that they lost their atmospheres,” said team member Raissa Estrela of the Jet Propulsion Laboratory at the California Institute of Technology in Pasadena, California, USA. But we looked at existing observations of this planet with Hubble and realised that there is an atmosphere there.”

“How many terrestrial planets don’t begin as terrestrials? Some may start as sub-Neptunes, and they become terrestrials through a mechanism whereby light evaporates the primordial atmosphere. This process works early in a planet’s life, when the star is hotter,” said team leader Mark Swain of the Jet Propulsion Laboratory. “Then the star cools down and the planet’s just sitting there. So you’ve got this mechanism that can cook off the atmosphere in the first 100 million years, and then things settle down. And if you can regenerate the atmosphere, maybe you can keep it.”

In some ways, GJ 1132 b has various parallels to Earth, but in some ways it is also very different. Both have similar densities, similar sizes, and similar ages, being about 4.5 billion years old. Both started with a hydrogen-dominated atmosphere, and both were hot before they cooled down. The team’s work even suggests that GJ 1132 b and Earth have similar atmospheric pressure at the surface.

This plot shows the spectrum of the atmosphere of an Earth sized rocky exoplanet, GJ 1132 b, which is overlaid on an artist’s impression of the planet. The orange line represents the model spectrum. In comparison, the observed spectrum is shown as blue dots representing averaged data points, along with their error bars.  This analysis is consistent with GJ 1132 b being predominantly a hydrogen atmosphere with a mix of methane and hydrogen cyanide. The planet also has aerosols which cause scattering of light.  This is the first time a so-called “secondary atmosphere,” which was replenished after the planet lost its primordial atmosphere, has been detected on a world outside of our solar system. Credit:
NASA, ESA, and P. Jeffries (STScI)

However, the planets’ formation histories are profoundly different. Earth is not believed to be the surviving core of a sub-Neptune. And Earth orbits at a comfortable distance from our yellow dwarf Sun. GJ 1132 b is so close to its host red dwarf star that it completes an orbit the star once every day and a half. This extremely close proximity keeps GJ 1132 b tidally locked, showing the same face to its star at all times — just as our moon keeps one hemisphere permanently facing Earth.

“The question is, what is keeping the mantle hot enough to remain liquid and power volcanism?” asked Swain. “This system is special because it has the opportunity for quite a lot of tidal heating.”

The phenomenon of tidal heating occurs through friction, when energy from a planet’s orbit and rotation is dispersed as heat inside the planet. GJ 1132 b is in an elliptical orbit, and the tidal forces acting on it are strongest when it is closest to or farthest from its host star. At least one other planet in the host star’s system also exerts a gravitational pull on the planet. The consequences are that the planet is squeezed or stretched by this gravitational “pumping.” That tidal heating keeps the mantle liquid for a long time. A nearby example in our own Solar System is the Jovian moon, Io, which has continuous volcanism as a result of a tidal tug-of-war between Jupiter and the neighbouring Jovian moons.

The team believes the crust of GJ 1132 b is extremely thin, perhaps only hundreds of feet thick. That’s much too feeble to support anything resembling volcanic mountains. Its flat terrain may also be cracked like an eggshell by tidal flexing. Hydrogen and other gases could be released through such cracks.

“This atmosphere, if it’s thin — meaning if it has a surface pressure similar to Earth — probably means you can see right down to the ground at infrared wavelengths. That means that if astronomers use the James Webb Space Telescope to observe this planet, there’s a possibility that they will see not the spectrum of the atmosphere, but rather the spectrum of the surface,” explained Swain. “And if there are magma pools or volcanism going on, those areas will be hotter. That will generate more emission, and so they’ll potentially be looking at the actual geological activity — which is exciting!”

This result is significant because it gives exoplanet scientists a way to figure out something about a planet’s geology from its atmosphere,” added Rimmer. “It is also important for understanding where the rocky planets in our own Solar System — Mercury, Venus, Earth and Mars, fit into the bigger picture of comparative planetology, in terms of the availability of hydrogen versus oxygen in the atmosphere.”

###

Notes:

[1] The observations were conducted as part of the Hubble observing program #14758 (PI: Zach Berta-Thomson).