Discovery of world’s oldest DNA breaks record by one million years
Two-million-year-old DNA has been identified for the first time opening a new chapter in the history of evolution.
Reconstruction of Kap København formation two-million years ago in a time where the temperature was significantly warmer than northernmost Greenland today. Credits: Beth Zaiken/bethzaiken.com
Microscopic fragments of environmental DNA were found in Ice Age sediment in northern Greenland. The fragments are one million years older than the previous record for DNA sampled from a Siberian mammoth bone.
The ancient DNA has been used to map a two-million-year-old ecosystem which weathered extreme climate change. The results could help predict the long-term environmental toll of today’s global warming.
The discovery was made by a team of scientists led by Professor Eske Willerslev and Professor Kurt Kjær. Professor Willerslev is a Fellow of St John’s College, University of Cambridge and Director of the Lundbeck Foundation GeoGenetics Centre at the University of Copenhagen where Professor Kjær, a geology expert, is also based.
The results of the 41 usable samples found hidden in clay and quartz are published today in Nature.
“A new chapter spanning one million extra years of history has finally been opened and for the first time we can look directly at the DNA of a past ecosystem that far back in time,” says Willerslev.
“DNA can degrade quickly but we’ve shown that under the right circumstances, we can now go back further in time than anyone could have dared imagine.”
“The ancient DNA samples were found buried deep in sediment that had built-up over 20,000 years,” says Kjær. “The sediment was eventually preserved in ice or permafrost and, crucially, not disturbed by humans for two million years.”
Close-up of organic material in the coastal deposits. The organic layers show traces of the rich plant flora and insect fauna that lived two million years ago in Kap København in North Greenland. Credits: Professor Kurt H. Kjær
The incomplete samples, a few millionths of a millimetre long, were taken from the København Formation, a sediment deposit almost 100 metres thick tucked in the mouth of a fjord in the Arctic Ocean in Greenland’s northernmost point. The climate in Greenland at the time varied between Arctic and temperate and was between 10-17C warmer than Greenland is today. The sediment built up metre by metre in a shallow bay.
Evidence of animals, plants and microorganisms including reindeer, hares, lemmings, birch and poplar trees were discovered. Researchers even found that Mastodon, an Ice Age mammal, roamed as far as Greenland before later becoming extinct. Previously it was thought the range of the elephant-like animals did not extend as far as Greenland from its known origins of North and Central America.
Detective work by 40 researchers from Denmark, the UK, France, Sweden, Norway, the USA and Germany, unlocked the secrets of the fragments of DNA. The process was painstaking – first they needed to establish whether there was DNA hidden in the clay and quartz, and if there was, could they successfully detach the DNA from the sediment to examine it? The answer, eventually, was yes. The researchers compared every single DNA fragment with extensive libraries of DNA collected from present-day animals, plants and microorganisms. A picture began to emerge of the DNA from trees, bushes, birds, animals and microorganisms.
A two million- year-old trunk from a larch tree still stuck in the permafrost within the coastal deposits. The tree was carried to the sea by the rivers that eroded the former forested landscape. Credits: Professor Svend Funder
Some of the DNA fragments were easy to classify as predecessors to present-day species, others could only be linked at genus level, and some originated from species impossible to place in the DNA libraries of animals, plants and microorganisms still living in the 21st century.
The two-million-year-old samples also help academics build a picture of a previously unknown stage in the evolution of the DNA of a range of species still in existence today.
“Expeditions are expensive and many of the samples were taken back in 2006 when the team were in Greenland for another project, they have been stored ever since,” says Kjær.
“It wasn’t until a new generation of DNA extraction and sequencing equipment was developed that we’ve been able to locate and identify extremely small and damaged fragments of DNA in the sediment samples. It meant we were finally able to map a two-million-year-old ecosystem.”
“The Kap København ecosystem, which has no present-day equivalent, existed at considerably higher temperatures than we have today – and because, on the face of it, the climate seems to have been similar to the climate we expect on our planet in the future due to global warming,” says co-first author Assistant Professor Mikkel Pedersen of the Lundbeck Foundation GeoGenetics Centre.
“One of the key factors here is to what degree species will be able to adapt to the change in conditions arising from a significant increase in temperature. The data suggests that more species can evolve and adapt to wildly varying temperatures than previously thought. But, crucially, these results show they need time to do this. The speed of today’s global warming means organisms and species do not have that time so the climate emergency remains a huge threat to biodiversity and the world – extinction is on the horizon for some species including plants and trees.”
While reviewing the ancient DNA from the Kap København Formation, the researchers also found DNA from a wide range of microorganisms, including bacteria and fungi, which they are continuing to map. A detailed description of how the interaction – between animals, plants and single-cell organisms – within the former ecosystem at Greenland’s northernmost point worked biologically will be presented in a future research paper.
It is now hoped that some of the ‘tricks’ of the two-million-year-old plant DNA discovered may be used to help make some endangered species more resistant to a warming climate.
“It is possible that genetic engineering could mimic the strategy developed by plants and trees two million years ago to survive in a climate characterised by rising temperatures and prevent the extinction of some species, plants and trees,” says Kjær. “This is one of the reasons this scientific advance is so significant because it could reveal how to attempt to counteract the devastating impact of global warming.”
Discovery of world’s oldest DNA breaks record by one million years: Artist’s impression of Kap København Formation today. Credits: Artist Beth Zaiken
The findings from the Kap København Formation in Greenland have opened up a whole new period in DNA detection.
“DNA generally survives best in cold, dry conditions such as those that prevailed during most of the period since the material was deposited at Kap København,” says Willerslev. “Now that we have successfully extracted ancient DNA from clay and quartz, it may be possible that clay may have preserved ancient DNA in warm, humid environments in sites found in Africa.
“If we can begin to explore ancient DNA in clay grains from Africa, we may be able to gather ground-breaking information about the origin of many different species – perhaps even new knowledge about the first humans and their ancestors – the possibilities are endless.”
Newly thawed moss from the permafrost coastal deposits. The moss originates from erosion of the river that cut through the landscape at Kap København some two million years ago. Credits: Professor Nicolaj K. Larsen
Bibliographic information:
A 2-million-year-old ecosystem in Greenland uncovered by environmental DNA, Nature (7-Dec-2022), DOI: 10.1038/s41586-022-05453-y
Press release from the University of Cambridge on the discovery of world’s oldest DNA.
WWII shipwreck has leaked many pollutants into the sea, changing the ocean floor around it
Researchers have discovered that an 80 year old historic World War II shipwreck is still influencing the microbiology and geochemistry of the ocean floor where it rests. In Frontiers in Marine Science, they show how the wreck is leaking hazardous pollutants, such as explosives and heavy metals, into the ocean floor sediment of the North Sea, influencing the marine microbiology around it.
The seabed of the North Sea is covered in thousands of ship and aircraft wrecks, warfare agents, and millions of tons of conventional munition such as shells and bombs. Wrecks contain hazardous substances (such as petroleum and explosives) that may harm the marine environment. Yet, there is a lack of information about the location of the wrecks, and the effect they might have on the environment.
“The general public is often quite interested in shipwrecks because of their historical value, but the potential environmental impact of these wrecks is often overlooked,” said PhD candidate Josefien Van Landuyt, of Ghent University.
For example, it is estimated that World War I and II shipwrecks around the world collectively contain between 2.5m and 20.4m tons of petroleum products.
“While wrecks can function as artificial reefs and have tremendous human story-telling value, we should not forget that they can be dangerous, human-made objects which were unintentionally introduced into a natural environment,” Van Landuyt continued. “Today, new shipwrecks are removed for this exact reason.”
As part of the North Sea Wrecks project, Van Landuyt and her colleagues investigated how the World War II shipwreck V-1302 John Mahn in the Belgian part of the North Sea is impacting the microbiome and geochemistry in its surrounding seabed.
“We wanted to see if old shipwrecks in our part of the sea (Belgium) were still shaping the local microbial communities and if they were still affecting the surrounding sediment. This microbial analysis is unique within the project,” explained Van Landuyt.
Dangerous chemicals and corroding microbes
The V-1302 John Mahn was a German fishing trawler that was requisitioned during World War II to use as a patrol boat. In 1942, during ‘the Channel Dash’, it was attacked by the British Royal Air Force in front of the Belgian coast, where it quickly sank to the bottom of the sea.
To analyze the bio- and geochemistry around the shipwreck, the researchers took steel hull and sediment samples from and around it, at an increasing distance from it and in different directions.
They found varying degrees of concentrations of toxic pollutants depending on the distance from the shipwreck. Most notably, they found heavy metals (such as nickel and copper), polycyclic aromatic hydrocarbons (PAHs; chemicals that occur naturally in coal, crude oil, and gasoline), arsenic, and explosive compounds.
The highest metal concentrations were found in the sample closest to the ship’s coal bunker. The freshly deposited sediment in the wake of the wreck had a high metal content. The highest PAH concentrations were closest to the ship.
“Although we don’t see these old shipwrecks, and many of us don’t know where they are, they can still be polluting our marine ecosystem,” explained Van Landuyt.
“In fact, their advancing age might increase the environmental risk due to corrosion, which is opening up previously enclosed spaces. As such, their environmental impact is still evolving.”
They also found that the ship influenced the microbiome around it. Known PAH degrading microbes like Rhodobacteraceae and Chromatiaceae were found in samples with the highest pollutant content. Moreover, sulfate reducing bacteria (such as Desulfobulbia) were present in the hull samples, likely leading to the corrosion of the steel hull.
Forgotten polluters
This study is only the tip of the iceberg, Van Landuyt explained: “People often forget that below the sea surface, we, humans, have already made quite an impact on the local animals, microbes, and plants living there and are still making an impact, leaching chemicals, fossil fuels, heavy metals from — sometimes century old — wrecks we don’t even remember are there.”
“We only investigated one ship, at one depth, in one location. To get a better overview of the total impact of shipwrecks on our North Sea, a large number of shipwrecks in various locations would have to be sampled,” Van Landuyt concluded.
Press release from Frontiers
Sunken WW II warship continues to leak hazardous substances
A shipwreck from the Second World War is still leaking hazardous substances into the North Sea. Bio-engineers from Ghent University teamed up with the Flanders Marine Institute (VLIZ) to study the impact of this shipwreck on marine life.
Location of the wreck of the fishing boat V-1302 John Mahn in the North Sea
The bed of the North Sea is littered with thousands of shipwrecks and planes from the war, and these contain all kinds of hazardous substances, such as explosives and petroleum.
Among these wrecks is the fishing boat V-1302 John Mahn. This was captured by the Germans during the Second World War and used as a patrol ship. In 1942, the John Mahn was struck off the Belgian coast during air attacks by the British Airforce when it was part of Operation Cerberus, a convoy of over 200 ships, which were required to escort German warships from Brittany to German ports. The ship sank quickly to the bottom of the sea. Other than a missing superstructure and large tear on the port side, the wreck is still very intact.
Bio-engineer Josefien Van Landuyt examined samples of sediment in the area around the sunken John Mahn. In doing so, she aimed to discover whether old shipwrecks in the Belgian section of the North Sea continue to affect microbial marine life.
Fishing boat V-1302 John Mahn. The WWII shipwreck has leaked many pollutants into the sea
Substances found
“We found varying levels of toxic substances, depending on how far from the shipwreck the samples were taken: predominantly heavy metals, such as nickel and copper, arsenic, explosive substances and chemicals that naturally occur in coal, crude oil and petrol”, explains Josefien. “The wreck also has an impact on the micro-organisms in the area: we discovered different microbes and bacteria than in other parts of the sea.”
How dangerous is it?
“In fact, it’s not too bad”, says Josefien. “The quantities of hazardous substances involved are pretty small. Yet what’s remarkable is the fact that the impact of the wreck is still present, even 80 years on. Also, we don’t know how this wreck will evolve: the fuel tank might still be intact and could start leaking in the future. Further investigations are needed to find out.”
Impact on marine life
“It’s all relative. If you view the wreck purely as a construction, you could even say that it has a positive impact on biodiversity. You could see it as an artificial reef; this is an interesting environment for all kinds of animal and plant species.”
“Furthermore, the chemical substances and metals in the shipwreck caused the appearance of other types of bacteria, which use these chemical substances and metals as a source of energy. You could consider it a natural solution for the contamination issue.”
Other wrecks
“In addition to this one, there are also many other shipwrecks at the bottom of the North Sea. With its North Sea Wrecks project, the Flanders Marine Institute is investigating which wrecks are where and in what condition. My research is part of this project. Much work remains before there is a complete picture of the number of shipwrecks and the risks they present”, confirms Josefien.
Bibliographic information:
Van Landuyt, J.; Kundu, K.; Van Haelst, S.; Neyts, M.; Parmentier, K.; De Rijcke, M. and Boon, N. (2022, October 18). 80 years later: Marine sediments still influenced by an old war ship. In Frontiers in Marine Science, Sec. Aquatic Microbiology, https://www.frontiersin.org/articles/10.3389/fmars.2022.1017136/full
Press release from Ghent University on the WWII shipwreck still leaking pollutants into the sea.
Astronomers reveal first image of the black hole at the heart of our galaxy
Today, at simultaneous press conferences around the world, including at the European Southern Observatory (ESO) headquarters in Germany, astronomers have unveiled the first image of the supermassive black hole at the centre of our own Milky Way galaxy. This result provides overwhelming evidence that the object is indeed a black hole and yields valuable clues about the workings of such giants, which are thought to reside at the centre of most galaxies. The image was produced by a global research team called the Event Horizon Telescope (EHT) Collaboration, using observations from a worldwide network of radio telescopes.
The black hole at the heart of our galaxy. This artist’s impression depicts a rapidly spinning supermassive black hole surrounded by an accretion disc. This thin disc of rotating material consists of the leftovers of a Sun-like star which was ripped apart by the tidal forces of the black hole. The black hole is labelled, showing the anatomy of this fascinating object. Credit:ESOThe black hole at the heart of our galaxy. This chart shows the location of the field of view within which Sagittarius A* resides — the black hole is marked with a red circle within the constellation of Sagittarius (The Archer). This map shows most of the stars visible to the unaided eye under good conditions. Credit:ESO, IAU and Sky & Telescope
The image is a long-anticipated look at the massive object that sits at the very centre of our galaxy. Scientists had previously seen stars orbiting around something invisible, compact, and very massive at the centre of the Milky Way. This strongly suggested that this object — known as Sagittarius A* (Sgr A*, pronounced “sadge-ay-star”) — is a black hole, and today’s image provides the first direct visual evidence of it.
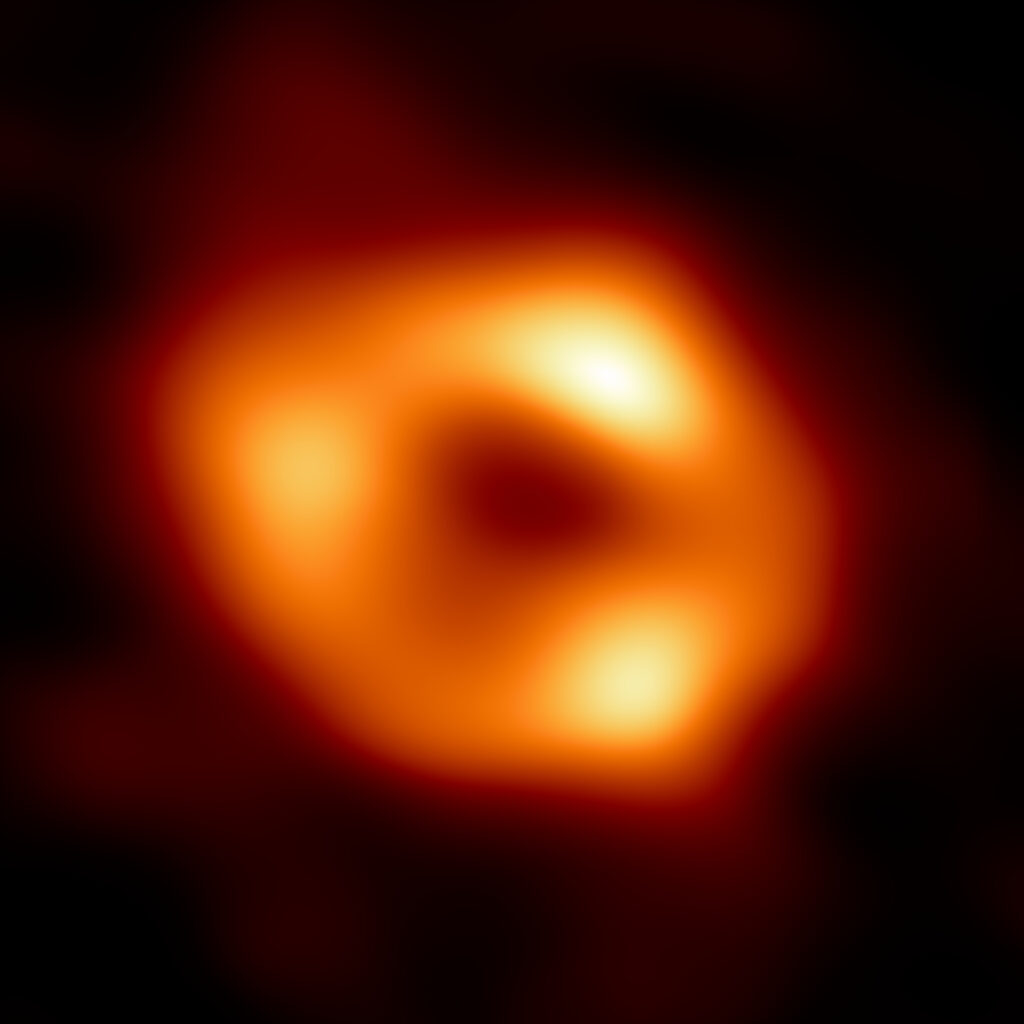
The black hole at the heart of our galaxy. This is the first image of Sgr A*, the supermassive black hole at the centre of our galaxy. It’s the first direct visual evidence of the presence of this black hole. It was captured by the Event Horizon Telescope (EHT), an array which linked together eight existing radio observatories across the planet to form a single “Earth-sized” virtual telescope. The telescope is named after the event horizon, the boundary of the black hole beyond which no light can escape. Although we cannot see the event horizon itself, because it cannot emit light, glowing gas orbiting around the black hole reveals a telltale signature: a dark central region (called a shadow) surrounded by a bright ring-like structure. The new view captures light bent by the powerful gravity of the black hole, which is four million times more massive than our Sun. The image of the Sgr A* black hole is an average of the different images the EHT Collaboration has extracted from its 2017 observations. In addition to other facilities, the EHT network of radio observatories that made this image possible includes the Atacama Large Millimeter/submillimeter Array (ALMA) and the Atacama Pathfinder EXperiment (APEX) in the Atacama Desert in Chile, co-owned and co-operated by ESO is a partner on behalf of its member states in Europe. Credit: EHT Collaboration
Although we cannot see the black hole itself, because it is completely dark, glowing gas around it reveals a telltale signature: a dark central region (called a shadow) surrounded by a bright ring-like structure. The new view captures light bent by the powerful gravity of the black hole, which is four million times more massive than our Sun.
“We were stunned by how well the size of the ring agreed with predictions from Einstein’s Theory of General Relativity,” said EHT Project Scientist Geoffrey Bower from the Institute of Astronomy and Astrophysics, Academia Sinica, Taipei. “These unprecedented observations have greatly improved our understanding of what happens at the very centre of our galaxy, and offer new insights on how these giant black holes interact with their surroundings.” The EHT team’s results are being published today in a special issue of The Astrophysical Journal Letters.
Because the black hole is about 27 000 light-years away from Earth, it appears to us to have about the same size in the sky as a doughnut on the Moon. To image it, the team created the powerful EHT, which linked together eight existing radio observatories across the planet to form a single “Earth-sized” virtual telescope [1]. The EHT observed Sgr A* on multiple nights in 2017, collecting data for many hours in a row, similar to using a long exposure time on a camera.
The black hole at the heart of our galaxy. The Event Horizon Telescope (EHT) Collaboration has created a single image (top frame) of the supermassive black hole at the centre of our galaxy, called Sagittarius A*, or Sgr A* for short, by combining images extracted from the EHT observations. The main image was produced by averaging together thousands of images created using different computational methods — all of which accurately fit the EHT data. This averaged image retains features more commonly seen in the varied images, and suppresses features that appear infrequently. The images can also be clustered into four groups based on similar features. An averaged, representative image for each of the four clusters is shown in the bottom row. Three of the clusters show a ring structure but, with differently distributed brightness around the ring. The fourth cluster contains images that also fit the data but do not appear ring-like. The bar graphs show the relative number of images belonging to each cluster. Thousands of images fell into each of the first three clusters, while the fourth and smallest cluster contains only hundreds of images. The heights of the bars indicate the relative “weights,” or contributions, of each cluster to the averaged image at top. In addition to other facilities, the EHT network of radio observatories that made this image possible includes the Atacama Large Millimeter/submillimeter Array (ALMA) and the Atacama Pathfinder EXperiment (APEX) in the Atacama Desert in Chile, co-owned and co-operated by ESO is a partner on behalf of its member states in Europe. Credit: EHT Collaboration
In addition to other facilities, the EHT network of radio observatories includes the Atacama Large Millimeter/submillimeter Array (ALMA) and the Atacama Pathfinder EXperiment (APEX) in the Atacama Desert in Chile, co-owned and co-operated by ESO on behalf of its member states in Europe. Europe also contributes to the EHT observations with other radio observatories — the IRAM 30-meter telescope in Spain and, since 2018, the NOrthern Extended Millimeter Array (NOEMA) in France — as well as a supercomputer to combine EHT data hosted by the Max Planck Institute for Radio Astronomy in Germany. Moreover, Europe contributed with funding to the EHT consortium project through grants by the European Research Council and by the Max Planck Society in Germany.
This image shows the Atacama Large Millimeter/submillimeter Array (ALMA) looking up at the Milky Way as well as the location of Sagittarius A*, the supermassive black hole at our galactic centre. Highlighted in the box is the image of Sagittarius A* taken by the Event Horizon Telescope (EHT) Collaboration. Located in the Atacama Desert in Chile, ALMA is the most sensitive of all the observatories in the EHT array, and ESO is a co-owner of ALMA on behalf of its European Member States. Credit: ESO/José Francisco Salgado (josefrancisco.org), EHT Collaboration
“It is very exciting for ESO to have been playing such an important role in unravelling the mysteries of black holes, and of Sgr A* in particular, over so many years,” commented ESO Director General Xavier Barcons. “ESO not only contributed to the EHT observations through the ALMA and APEX facilities but also enabled, with its other observatories in Chile, some of the previous breakthrough observations of the Galactic centre.” [2]
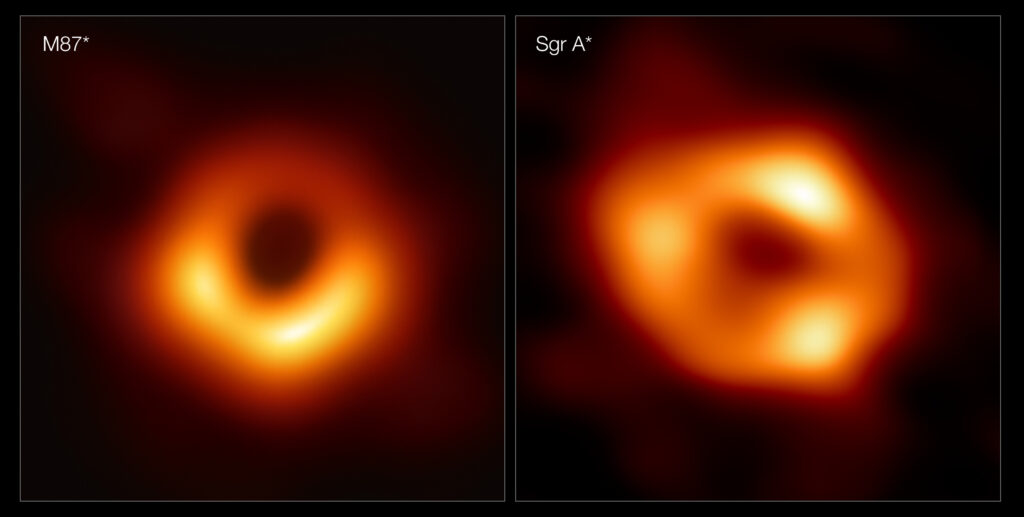
The EHT achievement follows the collaboration’s 2019 release of the first image of a black hole, called M87*, at the centre of the more distant Messier 87 galaxy.
These panels show the first two images ever taken of black holes. On the left is M87*, the supermassive black hole at the centre of the galaxy Messier 87 (M87), 55 million light-years away. On the right is Sagittarius A* (Sgr A*), the black hole at the centre of our Milky Way. The two images show the black holes as they would appear in the sky, with their bright rings appearing to be roughly the same size, despite M87* being around a thousand times larger than Sgr A*. The images were captured by the Event Horizon Telescope (EHT), a global network of radio telescopes including the Atacama Large Millimeter/submillimeter Array (ALMA) and Atacama Pathfinder EXperiment (APEX), in which ESO is co-owner. Credit: EHT Collaboration
The two black holes look remarkably similar, even though our galaxy’s black hole is more than a thousand times smaller and less massive than M87* [3].
“We have two completely different types of galaxies and two very different black hole masses, but close to the edge of these black holes they look amazingly similar,” says Sera Markoff, Co-Chair of the EHT Science Council and a professor of theoretical astrophysics at the University of Amsterdam, the Netherlands.
“This tells us that General Relativity governs these objects up close, and any differences we see further away must be due to differences in the material that surrounds the black holes.”
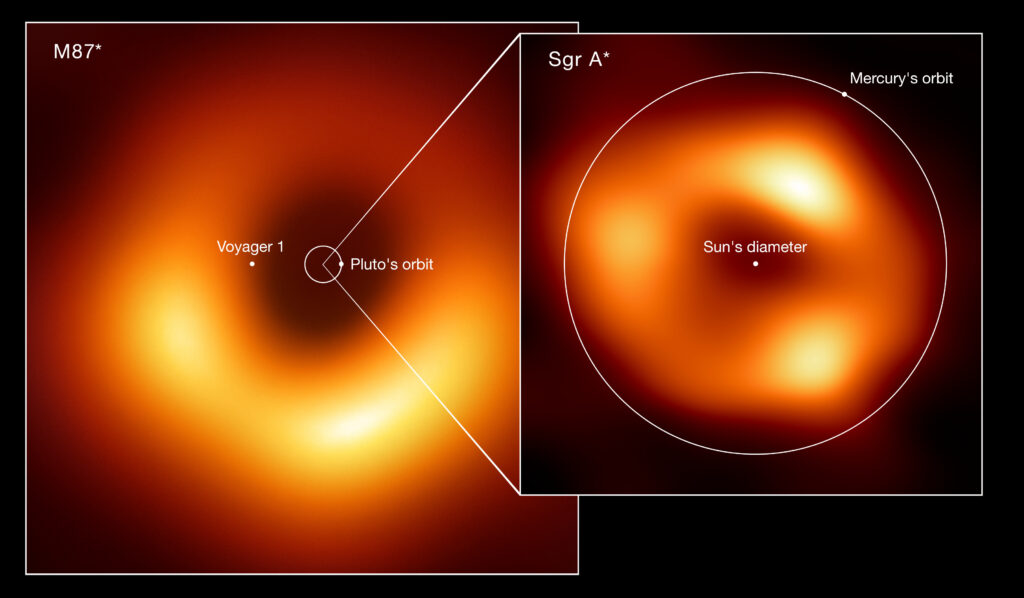
Size comparison of the two black holes imaged by the Event Horizon Telescope (EHT) Collaboration: M87*, at the heart of the galaxy Messier 87, and Sagittarius A* (Sgr A*), at the centre of the Milky Way. The image shows the scale of Sgr A* in comparison with both M87* and other elements of the Solar System such as the orbits of Pluto and Mercury. Also displayed is the Sun’s diameter and the current location of the Voyager 1 space probe, the furthest spacecraft from Earth. M87*, which lies 55 million light-years away, is one of the largest black holes known. While Sgr A*, 27 000 light-years away, has a mass roughly four million times the Sun’s mass, M87* is more than 1000 times more massive. Because of their relative distances from Earth, both black holes appear the same size in the sky. Credit: EHT collaboration (acknowledgment: Lia Medeiros, xkcd)
This achievement was considerably more difficult than for M87*, even though Sgr A* is much closer to us. EHT scientist Chi-kwan (‘CK’) Chan, from Steward Observatory and Department of Astronomy and the Data Science Institute of the University of Arizona, USA, explains:
“The gas in the vicinity of the black holes moves at the same speed — nearly as fast as light — around both Sgr A* and M87*. But where gas takes days to weeks to orbit the larger M87*, in the much smaller Sgr A* it completes an orbit in mere minutes. This means the brightness and pattern of the gas around Sgr A* were changing rapidly as the EHT Collaboration was observing it — a bit like trying to take a clear picture of a puppy quickly chasing its tail.”
The researchers had to develop sophisticated new tools that accounted for the gas movement around Sgr A*. While M87* was an easier, steadier target, with nearly all images looking the same, that was not the case for Sgr A*. The image of the Sgr A* black hole is an average of the different images the team extracted, finally revealing the giant lurking at the centre of our galaxy for the first time.
The effort was made possible through the ingenuity of more than 300 researchers from 80 institutes around the world that together make up the EHT Collaboration. In addition to developing complex tools to overcome the challenges of imaging Sgr A*, the team worked rigorously for five years, using supercomputers to combine and analyse their data, all while compiling an unprecedented library of simulated black holes to compare with the observations.
Scientists are particularly excited to finally have images of two black holes of very different sizes, which offers the opportunity to understand how they compare and contrast. They have also begun to use the new data to test theories and models of how gas behaves around supermassive black holes. This process is not yet fully understood but is thought to play a key role in shaping the formation and evolution of galaxies.
“Now we can study the differences between these two supermassive black holes to gain valuable new clues about how this important process works,” said EHT scientist Keiichi Asada from the Institute of Astronomy and Astrophysics, Academia Sinica, Taipei. “We have images for two black holes — one at the large end and one at the small end of supermassive black holes in the Universe — so we can go a lot further in testing how gravity behaves in these extreme environments than ever before.”
Progress on the EHT continues: a major observation campaign in March 2022 included more telescopes than ever before. The ongoing expansion of the EHT network and significant technological upgrades will allow scientists to share even more impressive images as well as movies of black holes in the near future.
This visible light wide-field view shows the rich star clouds in the constellation of Sagittarius (the Archer) in the direction of the centre of our Milky Way galaxy. The entire image is filled with vast numbers of stars — but far more remain hidden behind clouds of dust and are only revealed in infrared images. This view was created from photographs in red and blue light and form part of the Digitized Sky Survey 2. The field of view is approximately 3.5 degrees x 3.6 degrees. Credit:ESO and Digitized Sky Survey 2. Acknowledgment: Davide De Martin and S. Guisard (www.eso.org/~sguisard)
The black hole at the heart of our galaxy
Notes
[1] The individual telescopes involved in the EHT in April 2017, when the observations were conducted, were: the Atacama Large Millimeter/submillimeter Array (ALMA), the Atacama Pathfinder EXperiment (APEX), the IRAM 30-meter Telescope, the James Clerk Maxwell Telescope (JCMT), the Large Millimeter Telescope Alfonso Serrano (LMT), the Submillimeter Array (SMA), the UArizona Submillimeter Telescope (SMT), the South Pole Telescope (SPT). Since then, the EHT has added the Greenland Telescope (GLT), the NOrthern Extended Millimeter Array (NOEMA) and the UArizona 12-meter Telescope on Kitt Peak to its network.
ALMA is a partnership of the European Southern Observatory (ESO; Europe, representing its member states), the U.S. National Science Foundation (NSF), and the National Institutes of Natural Sciences (NINS) of Japan, together with the National Research Council (Canada), the Ministry of Science and Technology (MOST; Taiwan), Academia Sinica Institute of Astronomy and Astrophysics (ASIAA; Taiwan), and Korea Astronomy and Space Science Institute (KASI; Republic of Korea), in cooperation with the Republic of Chile. The Joint ALMA Observatory is operated by ESO, the Associated Universities, Inc./National Radio Astronomy Observatory (AUI/NRAO) and the National Astronomical Observatory of Japan (NAOJ). APEX, a collaboration between the Max Planck Institute for Radio Astronomy (Germany), the Onsala Space Observatory (Sweden) and ESO, is operated by ESO. The 30-meter Telescope is operated by IRAM (the IRAM Partner Organizations are MPG [Germany], CNRS [France] and IGN [Spain]). The JCMT is operated by the East Asian Observatory on behalf of The National Astronomical Observatory of Japan; ASIAA; KASI; the National Astronomical Research Institute of Thailand; the Center for Astronomical Mega-Science and organisations in the United Kingdom and Canada. The LMT is operated by INAOE and UMass, the SMA is operated by Center for Astrophysics | Harvard & Smithsonian and ASIAA and the UArizona SMT is operated by the University of Arizona. The SPT is operated by the University of Chicago with specialised EHT instrumentation provided by the University of Arizona.
The Greenland Telescope (GLT) is operated by ASIAA and the Smithsonian Astrophysical Observatory (SAO). The GLT is part of the ALMA-Taiwan project, and is supported in part by the Academia Sinica (AS) and MOST. NOEMA is operated by IRAM and the UArizona 12-meter telescope at Kitt Peak is operated by the University of Arizona.
A montage of the radio observatories that form the Event Horizon Telescope (EHT) network, used to image the Milky Way’s central black hole, Sagittarius A*. These include the Atacama Large Millimeter/submillimeter Array (ALMA), the Atacama Pathfinder EXperiment (APEX), IRAM 30-meter telescope, James Clark Maxwell Telescope (JCMT), Large Millimeter Telescope (LMT), Submillimeter Array (SMA), Submillimetere Telescope (SMT) and South Pole Telescope (SPT). The slightly transparent telescopes in the background, represent the three telescopes added to the EHT Collaboration after 2018: the Greenland Telescope, the NOrthern Extended Millimeter Array (NOEMA) in France, and the UArizona ARO 12-meter Telescope at Kitt Peak. These telescopes were added to the array after the 2017 observations of Sagittarius A*. Credit: ESO/M. Kornmesser. Images of individual telescopes: ALMA: ESO APEX: ESO LMT: INAOE Archives GLT: N. Patel JCMT: EAO-W. Montgomerie SMT: D. Harvey 30m: N. Billot SPT: Wikipedia SMA: S. R. Schimpf NOEMA: IRAM Kitt Peak: Wikipedia Milky Way: N. Risinger (skysurvey.org)A montage of the radio observatories that form the Event Horizon Telescope (EHT) network used to image the Milky Way’s central black hole, Sagittarius A*. These include the Atacama Large Millimeter/submillimeter Array (ALMA), the Atacama Pathfinder EXperiment (APEX), IRAM 30-meter telescope, James Clark Maxwell Telescope (JCMT), Large Millimeter Telescope (LMT), Submillimeter Array (SMA), Submillimeter Telescope (SMT) and South Pole Telescope (SPT). The slightly transparent telescopes in the background represent the three telescopes added to the EHT network after 2018: the Greenland Telescope, the NOrthern Extended Millimeter Array (NOEMA) in France, and the UArizona ARO 12-meter Telescope at Kitt Peak. These telescopes were added to the array after the 2017 observations of Sagittarius A*. Credit: ESO/M. Kornmesser. Images of individual telescopes: ALMA: ESO APEX: ESO LMT: INAOE Archives GLT: N. Patel JCMT: EAO-W. Montgomerie SMT: D. Harvey 30m: N. Billot SPT: Wikipedia SMA: S. R. Schimpf NOEMA: IRAM Kitt Peak: Wikipedia Milky Way: N. Risinger (skysurvey.org)
[2] A strong basis for the interpretation of this new image was provided by previous research carried out on Sgr A*. Astronomers have known the bright, dense radio source at the centre of the Milky Way in the direction of the constellation Sagittarius since the 1970s. By measuring the orbits of several stars very close to our galactic centre over a period of 30 years, teams led by Reinhard Genzel (Director at the Max –Planck Institute for Extraterrestrial Physics in Garching near Munich, Germany) and Andrea M. Ghez (Professor in the Department of Physics and Astronomy at the University of California, Los Angeles, USA) were able to conclude that the most likely explanation for an object of this mass and density is a supermassive black hole. ESO’s facilities (including the Very Large Telescope and the Very Large Telescope Interferometer) and the Keck Observatory were used to carry out this research, which shared the 2020 Nobel Prize in Physics.
[3] Black holes are the only objects we know of where mass scales with size. A black hole a thousand times smaller than another is also a thousand times less massive.
The black hole at the heart of our galaxy: more information
This research was presented in six papers published today in The Astrophysical Journal Letters.
A global map showing the radio observatories that form the Event Horizon Telescope (EHT) network used to image the Milky Way’s central black hole, Sagittarius A*. The telescopes highlighted in yellow were part of the EHT network during the observations of Sagittarius A* in 2017. These include the Atacama Large Millimeter/submillimeter Array (ALMA), the Atacama Pathfinder EXperiment (APEX), IRAM 30-meter telescope, James Clark Maxwell Telescope (JCMT), Large Millimeter Telescope (LMT), Submillimeter Array (SMA), Submillimetere Telescope (SMT) and South Pole Telescope (SPT). Highlighted in blue are the three telescopes added to the EHT Collaboration after 2018: the Greenland Telescope, the NOrthern Extended Millimeter Array (NOEMA) in France, and the UArizona ARO 12-meter Telescope at Kitt Peak. Credit:ESO/M. Kornmesser
The EHT collaboration involves more than 300 researchers from Africa, Asia, Europe, North and South America. The international collaboration aims to capture the most detailed black hole images ever obtained by creating a virtual Earth-sized telescope. Supported by considerable international efforts, the EHT links existing telescopes using novel techniques — creating a fundamentally new instrument with the highest angular resolving power that has yet been achieved.
This image shows the locations of some of the telescopes making up the EHT, as well as a representation of the long baselines between the telescopes. Credit:ESO/L. Calçada
The EHT consortium consists of 13 stakeholder institutes; the Academia Sinica Institute of Astronomy and Astrophysics, the University of Arizona, the Center for Astrophysics | Harvard & Smithsonian, the University of Chicago, the East Asian Observatory, Goethe-Universitaet Frankfurt, Institut de Radioastronomie Millimétrique, Large Millimeter Telescope, Max Planck Institute for Radio Astronomy, MIT Haystack Observatory, National Astronomical Observatory of Japan, Perimeter Institute for Theoretical Physics, and Radboud University.
This view shows several of the ALMA antennas and the central regions of the Milky Way above. In this wide field view, the zodiacal light is seen upper right and at lower left Mars is seen. Saturn is a bit higher in the sky towards the centre of the image. The image was taken during the ESO Ultra HD (UHD) Expedition. Credit:ESO/B. Tafreshi (twanight.org)
The Atacama Large Millimeter/submillimeter Array (ALMA), an international astronomy facility, is a partnership of ESO, the U.S. National Science Foundation (NSF) and the National Institutes of Natural Sciences (NINS) of Japan in cooperation with the Republic of Chile. ALMA is funded by ESO on behalf of its Member States, by NSF in cooperation with the National Research Council of Canada (NRC) and the Ministry of Science and Technology (MOST) and by NINS in cooperation with the Academia Sinica (AS) in Taiwan and the Korea Astronomy and Space Science Institute (KASI). ALMA construction and operations are led by ESO on behalf of its Member States; by the National Radio Astronomy Observatory (NRAO), managed by Associated Universities, Inc. (AUI), on behalf of North America; and by the National Astronomical Observatory of Japan (NAOJ) on behalf of East Asia. The Joint ALMA Observatory (JAO) provides the unified leadership and management of the construction, commissioning and operation of ALMA.
The slumbering Atacama Pathfinder Experiment (APEX) telescope sits beneath reddened skies amongst the snow covered Chajnantor landscape. Snow not only blankets the ground, but also the many peaks that encircle the Chilean plateau which also hosts the Atacama Large Millimeter/submillimeter Array (ALMA). Credit:Carlos A. Durán/ESO
APEX, Atacama Pathfinder EXperiment, is a 12-metre diameter telescope, operating at millimetre and submillimetre wavelengths — between infrared light and radio waves. ESO operates APEX at one of the highest observatory sites on Earth, at an elevation of 5100 metres, high on the Chajnantor plateau in Chile’s Atacama region. The telescope is a collaboration between the Max Planck Institute for Radio Astronomy (MPIfR), the Onsala Space Observatory (OSO), and ESO.
This image shows the dish of the Atacama Pathfinder Experiment (APEX) telescope seen perfectly from the side, including the starry sky. Credit:C. Duran/ESOESO Photo Ambassador Stéphane Guisard captured this astounding panorama from the site of ALMA, the Atacama Large Millimeter/submillimeter Array, in the Chilean Andes. The 5000-metre-high and extremely dry Chajnantor plateau offers the perfect place for this state-of-the-art telescope, which studies the Universe in millimetre- and submillimetre-wavelength light. Numerous giant antennas dominate the centre of the image. When ALMA is complete, it will have a total of 54 of these 12-metre-diameter dishes. Above the array, the arc of the Milky Way serves as a resplendent backdrop. When the panorama was taken, the Moon was lying close to the centre of the Milky Way in the sky, its light bathing the antennas in an eerie night-time glow. The Large and Small Magellanic Clouds, the biggest of the Milky Way’s dwarf satellite galaxies, appear as two luminous smudges in the sky on the left. A particularly bright meteor streak gleams near the Small Magellanic Cloud. On the right, some of ALMA’s smaller 7-metre antennas — twelve of which will be used to form the Atacama Compact Array — can be seen. Still further on the right shine the lights of the Array Operations Site Technical Building. And finally, looming behind this building is the dark, mountainous peak of Cerro Chajnantor. ALMA, an international astronomy facility, is a partnership of Europe, North America and East Asia in cooperation with the Republic of Chile. ALMA construction and operations are led on behalf of Europe by ESO, on behalf of North America by the National Radio Astronomy Observatory (NRAO), and on behalf of East Asia by the National Astronomical Observatory of Japan (NAOJ). The Joint ALMA Observatory (JAO) provides the unified leadership and management of the construction, commissioning and operation of ALMA. Links ESO Photo Ambassadors More about ALMA at ESO The Joint ALMA Observatory. Links ESO Photo Ambassadors More about ALMA at ESO The Joint ALMA Observatory Credit:ESO/S. Guisard (www.eso.org/~sguisard)
The European Southern Observatory (ESO) enables scientists worldwide to discover the secrets of the Universe for the benefit of all. We design, build and operate world-class observatories on the ground — which astronomers use to tackle exciting questions and spread the fascination of astronomy — and promote international collaboration in astronomy. Established as an intergovernmental organisation in 1962, today ESO is supported by 16 Member States (Austria, Belgium, the Czech Republic, Denmark, France, Finland, Germany, Ireland, Italy, the Netherlands, Poland, Portugal, Spain, Sweden, Switzerland and the United Kingdom), along with the host state of Chile and with Australia as a Strategic Partner. ESO’s headquarters and its visitor centre and planetarium, the ESO Supernova, are located close to Munich in Germany, while the Chilean Atacama Desert, a marvellous place with unique conditions to observe the sky, hosts our telescopes. ESO operates three observing sites: La Silla, Paranal and Chajnantor. At Paranal, ESO operates the Very Large Telescope and its Very Large Telescope Interferometer, as well as two survey telescopes, VISTA working in the infrared and the visible-light VLT Survey Telescope. Also at Paranal ESO will host and operate the Cherenkov Telescope Array South, the world’s largest and most sensitive gamma-ray observatory. Together with international partners, ESO operates APEX and ALMA on Chajnantor, two facilities that observe the skies in the millimetre and submillimetre range. At Cerro Armazones, near Paranal, we are building “the world’s biggest eye on the sky” — ESO’s Extremely Large Telescope. From our offices in Santiago, Chile we support our operations in the country and engage with Chilean partners and society.
The black hole at the heart of our galaxy. This is the first image of Sgr A*, the supermassive black hole at the centre of our galaxy, with an added black background to fit wider screens. It’s the first direct visual evidence of the presence of this black hole. It was captured by the Event Horizon Telescope (EHT), an array which linked together eight existing radio observatories across the planet to form a single “Earth-sized” virtual telescope. The telescope is named after the event horizon, the boundary of the black hole beyond which no light can escape. Although we cannot see the event horizon itself, because it cannot emit light, glowing gas orbiting around the black hole reveals a telltale signature: a dark central region (called a shadow) surrounded by a bright ring-like structure. The new view captures light bent by the powerful gravity of the black hole, which is four million times more massive than our Sun. The image of the Sgr A* black hole is an average of the different images the EHT Collaboration has extracted from its 2017 observations. In addition to other facilities, the EHT network of radio observatories that made this image possible includes the Atacama Large Millimeter/submillimeter Array (ALMA) and the Atacama Pathfinder EXperiment (APEX) in the Atacama Desert in Chile, co-owned and co-operated by ESO is a partner on behalf of its member states in Europe. Credit:EHT Collaboration
Astrophysicists at the University of Jena (Germany) prove that dust particles in space are mixed with ice
Clouds of interstellar dust and gas, here in the region “Cygnus-X” in the Swan constellation. Credits: ESA/PACS/SPIRE/Martin Hennemann & Frédérique Motte, Laboratoire AIM Paris-Saclay, CEA/Irfu – CNRS/INSU – Univ. Paris Diderot, France
The matter between the stars in a galaxy – called the interstellar medium – consists not only of gas, but also of a great deal of dust. At some point in time, stars and planets originated in such an environment, because the dust particles can clump together and merge into celestial bodies. Important chemical processes also take place on these particles, from which complex organic – possibly even prebiotic – molecules emerge. However, for these processes to be possible, there has to be water. In particularly cold cosmic environments, water occurs in the form of ice. Until now, however, the connection between ice and dust in these regions of space was unclear. A research team from Friedrich Schiller University Jena and the Max Planck Institute for Astronomy has now proven that the dust particles and the ice are mixed. They report their findings in the current issue of the research journal “Nature Astronomy”.
Better modelling of physico-chemical processes in space
“Until now, we didn’t know whether ice is physically separated from the dust or mixed with individual dust moieties,” explains Dr Alexey Potapov of the University of Jena. “We compared the spectra of laboratory-made silicates, water ice and their mixtures with astronomical spectra of protostellar envelopes and protoplanetary disks. We established that the spectra are congruent if silicate dust and water ice are mixed in these environments.”
Astrophysicists can gain valuable information from this data. “We need to understand different physical conditions in different astronomical environments, in order to improve the modelling of physico-chemical processes in space,” says Potapov. This result would enable researchers to better estimate the amount of material and to make more accurate statements about the temperatures in different regions of the interstellar and circumstellar media.
Water trapped in dust
Through experiments and comparisons, scientists at the University of Jena also observed what happens with water when the temperatures increase and the ice leaves the solid body to which it is bound and passes into the gas phase at about 180 Kelvin (-93 degrees Celsius).
“Some water molecules are so strongly bound to the silicate that they remain on the surface or inside dust particles,” says Potapov. “We suspect that such ‘trapped water’ also exists on or in dust particles in space. At least that is what is suggested by the comparison between the spectra obtained from the laboratory experiments and those in what is called the diffuse interstellar medium. We found clear indications that trapped water molecules exist there.”
The existence of such solid-state water suggests that complex molecules may also be present on the dust particles in the diffuse interstellar medium. If water is present on such particles, it is not a very long way to complex organic molecules, for example. This is because the dust particles usually consist of carbon, among other things, which, in combination with water and under the influence of ultraviolet radiation such as that found in the environment, promotes the formation of methanol, for example. Organic compounds have already been observed in these regions of the interstellar medium, but until now it has not been known where they originated.
The presence of solid-state water can also answer questions about another element: although we know the amount of oxygen in the interstellar medium, we previously had no information about where exactly around a third of it is located. The new research results suggest that the solid-state water in silicates is a hidden reservoir of oxygen.
Does solid-state water help in the formation of planets?
In addition, the “trapped water” can help in understanding how the dust accumulates, as it could promote the sticking together of smaller particles to form larger particles. This effect may even work in planet formation. “If we succeed in proving that ‘trapped water’ existed – or could exist – in building blocks of the Earth, there might possibly even be new answers to the question of how water came to Earth,” says Alexey Potapov. But as yet, these are only suppositions that the Jena researchers want to pursue in the future.
[1] ESA/PACS/SPIRE/Martin Hennemann & Frédérique Motte, Laboratoire AIM Paris-Saclay, CEA/Irfu – CNRS/INSU – Univ. Paris Diderot, France
INFORMATION
Original publication: A. Potapov, J. Bouwman, C. Jäger, Th. Henning (2020): Dust/ice mixing in cold regions and solid-state water in the diffuse interstellar medium, Nature astronomy, https://doi.org/10.1038/s41550-020-01214-x
Press release from the Friedrich Schiller University Jena
Heat stress: the climate is putting European forests under sustained pressure
No year since weather records began was as hot and dry as 2018. A first comprehensive analysis of the consequences of this drought and heat event shows that central European forests sustained long-term damage. Even tree species considered drought-resistant, such as beech, pine and silver fir, suffered. The international study was directed by the University of Basel, which is conducting a forest experiment unique in Europe.
In a forest near Basel researchers study the effects of climate change on the most important and sensitive part of the trees – the canopy. A total of 450 trees between 50 and 120 years old grow on the 1.6 hectare research area. Credits: University of Basel
Until now, 2003 has been the driest and hottest year since regular weather records began. That record has now been broken. A comparison of climate data from Germany, Austria and Switzerland shows that 2018 was significantly warmer. The average temperature during the vegetation period was 1.2°C above the 2003 value and as high as 3.3°C above the average of the years from 1961 to 1990.
Part of the analysis, which has now been published, includes measurements taken at the Swiss Canopy Crane II research site in Basel, where extensive physiological investigations were carried out in tree canopies. The goal of these investigations is to better understand how and when trees are affected by a lack of water in order to counter the consequences of climate change through targeted management measures.
When trees die of thirst
Trees lose a lot of water through their surfaces. If the soil also dries out, the tree cannot replace this water, which is shown by the negative suction tension in the wood’s vascular tissue. It’s true that trees can reduce their water consumption, but if the soil water reservoir is used up, it’s ultimately only a matter of time until cell dehydration causes the death of a tree.
Physiological measurements at the Basel research site have shown the researchers that the negative suction tension and water shortage in trees occurred earlier than usual. In particular, this shortage was more severe throughout all of Germany, Austria and Switzerland than ever measured before. Over the course of the summer, severe drought-related stress symptoms therefore appeared in many tree species important to forestry. Leaves wilted, aged and were shed prematurely.
Death of a beech tree in a forest near Basel: during the 2018 heatwave the leaves died prematurely, the following year the tree stopped forming new shoots. Credits: Urs Weber, University of Basel
Spruce, pine and beech most heavily affected
The true extent of the summer heatwave became evident in 2019: many trees no longer formed new shoots – they were partially or wholly dead. Others had survived the stress of the drought and heat of the previous year, but were increasingly vulnerable to bark beetle infestation or fungus. Trees with partially dead canopies, which reduced the ability to recover from the damage, were particularly affected.
“Spruce was most heavily affected. But it was a surprise for us that beech, silver fir and pine were also damaged to this extent,” says lead researcher Professor Ansgar Kahmen. Beech in particular had until then been classified as the “tree of the future”, although its supposed drought resistance has been subject to contentious discussion since the 2003 heatwave.
Death of a beech tree in a forest near Basel: during the 2018 heatwave the leaves died prematurely, the following year the tree stopped foring new shoots. Credits: Urs Weber, University of Basel
Future scenarios to combat heat and drought
According to the latest projections, precipitation in Europe will decline by up to a fifth by 2085, and drought and heat events will become more frequent. Redesigning forests is therefore essential. “Mixed woodland is often propagated,” explains plant ecologist Kahmen, “and it certainly has many ecological and economic advantages. But whether mixed woodland is also more drought-resistant has not yet been clearly proven. We still need to study which tree species are good in which combinations, including from a forestry perspective. That will take a long time.”
Another finding of the study is that it is only possible to record the impacts of extreme climate events on European forests to a limited extent using conventional methods, and thus new analytical approaches are needed.“The damage is obvious. More difficult is precisely quantifying it and drawing the right conclusions for the future,” says Kahmen. Earth observation data from satellites could help track tree mortality on a smaller scale. Spatial patterns that contain important ecological and forestry-related information can be derived from such data: which tree species were heavily impacted, when and at which locations, and which survived without damage? “A system like this already exists in some regions in the US, but central Europe still lacks one.”
Original source
Schuldt, Bernhard & Buras, Allan & Arend, Matthias & Vitasse, Yann & Beierkuhnlein, Carl & Damm, Alexander & Gharun, Mana & Grams, Thorsten & Hauck, Markus & Hajek, Peter & Hartmann, Henrik & Hilbrunner, Erika & Hoch, Günter & Holloway-Phillips, Meisha & Körner, Christian & Larysch, Elena & Luebbe, Torben & Nelson, Daniel & Rammig, Anja & Kahmen, Ansgar.
Traffic density, wind and air stratification influence concentrations of air pollutant NO2
Leipzig researchers use a calculation method to remove weather influences from air pollution data
Traffic density, wind and air stratification influence the pollution with the air pollutant nitrogen dioxide, according to the conclusion of a TROPOS study commissioned by the LfULG. Credits: Burkhard Lehmann, LfULG
Leipzig/Dresden. In connection with the effects of the COVID-19 pandemic, satellite measurements made headlines showing how much the air pollutant nitrogen dioxide (NO2) had decreased in China and northern Italy. In Germany, traffic density is the most important factor. However, weather also has an influence on NO2 concentrations, according to a study by the Leibniz Institute for Tropospheric Research (TROPOS), which evaluated the influence of weather conditions on nitrogen dioxide concentrations in Saxony 2015 to 2018 on behalf of the Saxon State Office for Environment, Agriculture and Geology (LfULG). It was shown that wind speed and the height of the lowest air layer are the most important factors that determine how much pollutants can accumulate locally.
In order to determine the influence of various weather factors on air quality, the team used a statistical method that allows meteorological fluctuations to be mathematically removed from long-term measurements. The air quality fluctuates, in some cases very strongly, due to different emissions and the influence of the weather. Until now, however, it has been difficult to estimate, what share legal measures such as low emission zones or diesel driving bans have and what share the weather influences have in the actual air quality? With the method used, this will be easier in the future.
Nitrogen dioxide (NO2) is an irritant gas which attacks the mucous membrane of the respiratory tract, causes inflammatory reactions as an oxidant and increases the effect of other air pollutants. As a precursor substance, it can also contribute to the formation of particulate matter. Limit values have been set in the EU to protect the population: For nitrogen dioxide, an annual average value of 40 micrograms per cubic metre of air applies (μg/m³). To protect the health of the population, measures must be taken if these limit values are not complied with. In 2018/2019, for example, various measures were taken in Germany, ranging from a reduction in the number of lanes (e.g. in Leipzig) to driving bans for older diesel vehicles (e.g. in Stuttgart).
To evaluate the effectiveness of such measures, it would be helpful to determine the exact influence of weather conditions. The Saxon State Office for Environment, Agriculture and Geology (LfULG) therefore commissioned TROPOS to carry out a study on the influence of weather factors on NO2 concentrations and provided its measurement data from the Saxon air quality measurement network and meteorological data for this purpose. The researchers were thus able to evaluate data from 29 stations in Saxony over a period of four years, which represent a cross-section of air pollution – from stations at traffic centres to urban and rural background stations and stations on the ridge of the Erzgebirge mountains. They also calculated the height of the lowest layer in the atmosphere and incorporated data from traffic counting stations in Leipzig and Dresden into the study. A method from the field of machine learning was used for the statistical modelling, the application of which in the field of air quality was first published by British researchers in 2009.
In this way, the study was able to demonstrate that the traffic density at all traffic stations is most significantly responsible for nitrogen oxide concentrations. However, two weather parameters also have a significant influence on nitrogen dioxide concentrations: wind speed and the height of the so-called mixing layer. The latter is a meteorological parameter that indicates the height to which the lowest layer of air, where the emissions mix, extends. “It was also shown that high humidity can also reduce the concentration of nitrogen dioxide, which could be due to the fact that the pollutants deposit more strongly on moist surfaces. However, the exact causes are still unclear,” says Dominik van Pinxteren.
The statistical analysis has also enabled the researchers to remove the influence of the weather from the time series of pollutant concentrations: Adjusted for the weather, the concentration of nitrogen oxides (NOx) decreased by a total of 10 micrograms per cubic meter between 2015 and 2018 on average over all traffic stations in Saxony. In urban and rural areas and on the ridge of the Erzgebirge, however, NOx concentrations tend to remain at the same level. Even though there have been some improvements in air quality in recent years, there are good scientific arguments for further reducing air pollution.
In a way, this also applies to premature conclusions from the corona crisis: in order to find out how strong the influence of the initial restrictions on air quality actually was, the influence of the weather would have to be statistically removed in a longer series of measurements. To this end, investigations for the Leipzig area are currently underway at TROPOS, as is a Europe-wide study of the EU research infrastructure for short-lived atmospheric constituents such as aerosol, clouds and trace gases (ACTRIS), the German contribution to which is coordinated by TROPOS.
Publication:
Dominik van Pinxteren, Sebastian Düsing, Alfred Wiedensohler, Hartmut Herrmann (2020): Meteorological influences on nitrogen dioxide: Influence of weather conditions and weathering on nitrogen dioxide concentrations in outdoor air 2015 to 2018. Series of publications of the LfULG, issue 2/2020 (in German only) https://publikationen.sachsen.de/bdb/artikel/35043 This study was commissioned by the State Office for Environment, Agriculture and Geology (LfULG).
Press release on traffic density, wind and air stratification influence concentrations of air pollutant NO2 by Tilo Arnhold from the Leibniz Institute for Tropospheric Research (TROPOS)