New dinosaur species from Utah lived at a time of major transition: Iani smithi provides insights into how dinosaurs weather mid-Cretaceous ecological change.
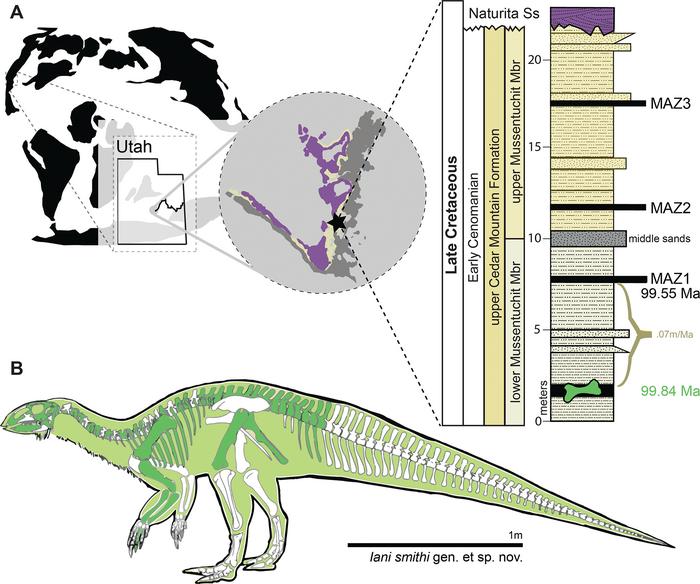
Location of holotype locality for Iani smithi. (A) Global map showing location of Mussentuchit Member outcrop in central Utah, western North America, and a stratigraphic section at the quarry with dated ash horizons; and (B) graphical representation of preserved skeletal elements of the holotype specimen. Preserved elements are colored on the left facing skeletal whether they derive from the right or left side of the body. Exact positions of chevrons and ribs unknown due to poor preservation. Credits: Zanno et al., 2023, PLoS ONE, CC-BY 4.0
A new species of dinosaur from Utah sheds light on major North American ecological changes around 100 million years ago, according to a study published June 7, 2023 in the open-access journal PLoS ONE by Lindsay Zanno of the North Carolina Museum of Natural Sciences and colleagues.
The boundary between the Early and Late Cretaceous Period saw major reassembly of global ecosystems associated with a peak in global temperatures. In the fossil record of western North America, this ecological shift has been well-documented for marine habitats, but less study has been done regarding terrestrial life. In this study, Zanno and colleagues identify a new dinosaur from the early Late Cretaceous Cedar Mountain Formation of Utah.
The new dinosaur, named Iani smithi, lived around 100 million years ago and is known from a single fossil specimen including a well-preserved skull and parts of the spine and limbs. The name derives from Ianus, a Roman deity who presided over transitions, referencing the changing world of the mid-Cretaceous.
Iani is a member of an early branch of the ornithopod dinosaurs, a group of mostly bipedal herbivores that also includes famous examples like Iguanodon and Tenontosaurus. Iani is the first early-diverging ornithopod known from the Late Cretaceous of North America.
This discovery, along with other recent reports from the same geologic formation, indicates that several major groups of dinosaurs survived into the early Late Cretaceous despite the ecological changes of the time, but exactly what these survivors were doing and how long they lasted is still unclear. Since Iani and its closest cousins are typically found in ancient coastal habitats along the shores of the now-vanished Western Interior Seaway, the authors suggest that more investigation into coastal deposits of similar age might yield further evidence to address these lingering questions.
The authors add: “Early ornithopodswere once a common part of North American ecosystems, but we did not know they survived into the Late Cretaceous. The discovery of Iani helps us link their extinction on the continent with a major interval of global warming, one with striking similarities to our current climate crisis.”
Bibliographic information:
Zanno LE, Gates TA, Avrahami HM, Tucker RT, Makovicky PJ (2023) An early-diverging iguanodontian (Dinosauria: Rhabdodontomorpha) from the Late Cretaceous of North America, PLoS ONE 18(6): e0286042. https://doi.org/10.1371/journal.pone.0286042
Astronomers reveal first image of the black hole at the heart of our galaxy
Today, at simultaneous press conferences around the world, including at the European Southern Observatory (ESO) headquarters in Germany, astronomers have unveiled the first image of the supermassive black hole at the centre of our own Milky Way galaxy. This result provides overwhelming evidence that the object is indeed a black hole and yields valuable clues about the workings of such giants, which are thought to reside at the centre of most galaxies. The image was produced by a global research team called the Event Horizon Telescope (EHT) Collaboration, using observations from a worldwide network of radio telescopes.
The black hole at the heart of our galaxy. This artist’s impression depicts a rapidly spinning supermassive black hole surrounded by an accretion disc. This thin disc of rotating material consists of the leftovers of a Sun-like star which was ripped apart by the tidal forces of the black hole. The black hole is labelled, showing the anatomy of this fascinating object. Credit:ESOThe black hole at the heart of our galaxy. This chart shows the location of the field of view within which Sagittarius A* resides — the black hole is marked with a red circle within the constellation of Sagittarius (The Archer). This map shows most of the stars visible to the unaided eye under good conditions. Credit:ESO, IAU and Sky & Telescope
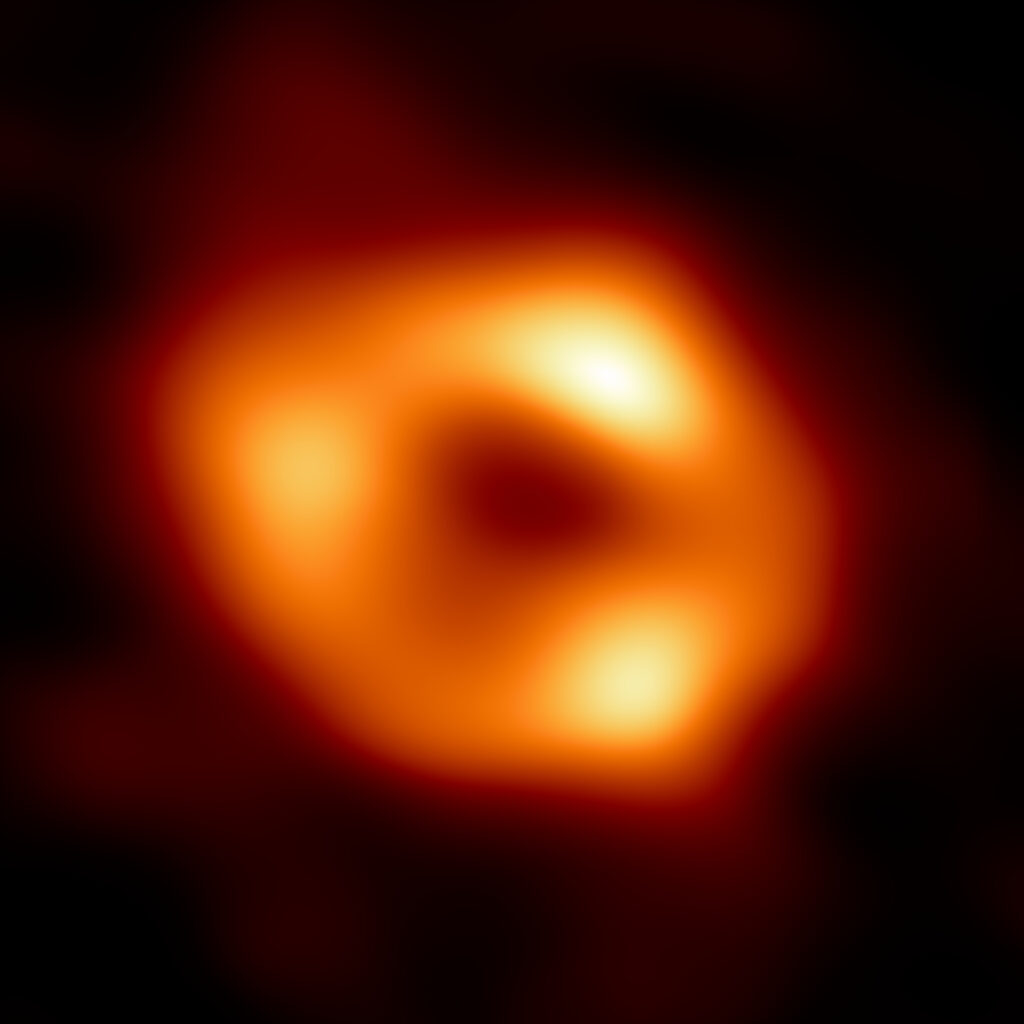
The image is a long-anticipated look at the massive object that sits at the very centre of our galaxy. Scientists had previously seen stars orbiting around something invisible, compact, and very massive at the centre of the Milky Way. This strongly suggested that this object — known as Sagittarius A* (Sgr A*, pronounced “sadge-ay-star”) — is a black hole, and today’s image provides the first direct visual evidence of it.
The black hole at the heart of our galaxy. This is the first image of Sgr A*, the supermassive black hole at the centre of our galaxy. It’s the first direct visual evidence of the presence of this black hole. It was captured by the Event Horizon Telescope (EHT), an array which linked together eight existing radio observatories across the planet to form a single “Earth-sized” virtual telescope. The telescope is named after the event horizon, the boundary of the black hole beyond which no light can escape. Although we cannot see the event horizon itself, because it cannot emit light, glowing gas orbiting around the black hole reveals a telltale signature: a dark central region (called a shadow) surrounded by a bright ring-like structure. The new view captures light bent by the powerful gravity of the black hole, which is four million times more massive than our Sun. The image of the Sgr A* black hole is an average of the different images the EHT Collaboration has extracted from its 2017 observations. In addition to other facilities, the EHT network of radio observatories that made this image possible includes the Atacama Large Millimeter/submillimeter Array (ALMA) and the Atacama Pathfinder EXperiment (APEX) in the Atacama Desert in Chile, co-owned and co-operated by ESO is a partner on behalf of its member states in Europe. Credit: EHT Collaboration
Although we cannot see the black hole itself, because it is completely dark, glowing gas around it reveals a telltale signature: a dark central region (called a shadow) surrounded by a bright ring-like structure. The new view captures light bent by the powerful gravity of the black hole, which is four million times more massive than our Sun.
“We were stunned by how well the size of the ring agreed with predictions from Einstein’s Theory of General Relativity,” said EHT Project Scientist Geoffrey Bower from the Institute of Astronomy and Astrophysics, Academia Sinica, Taipei. “These unprecedented observations have greatly improved our understanding of what happens at the very centre of our galaxy, and offer new insights on how these giant black holes interact with their surroundings.” The EHT team’s results are being published today in a special issue of The Astrophysical Journal Letters.
Because the black hole is about 27 000 light-years away from Earth, it appears to us to have about the same size in the sky as a doughnut on the Moon. To image it, the team created the powerful EHT, which linked together eight existing radio observatories across the planet to form a single “Earth-sized” virtual telescope [1]. The EHT observed Sgr A* on multiple nights in 2017, collecting data for many hours in a row, similar to using a long exposure time on a camera.
The black hole at the heart of our galaxy. The Event Horizon Telescope (EHT) Collaboration has created a single image (top frame) of the supermassive black hole at the centre of our galaxy, called Sagittarius A*, or Sgr A* for short, by combining images extracted from the EHT observations. The main image was produced by averaging together thousands of images created using different computational methods — all of which accurately fit the EHT data. This averaged image retains features more commonly seen in the varied images, and suppresses features that appear infrequently. The images can also be clustered into four groups based on similar features. An averaged, representative image for each of the four clusters is shown in the bottom row. Three of the clusters show a ring structure but, with differently distributed brightness around the ring. The fourth cluster contains images that also fit the data but do not appear ring-like. The bar graphs show the relative number of images belonging to each cluster. Thousands of images fell into each of the first three clusters, while the fourth and smallest cluster contains only hundreds of images. The heights of the bars indicate the relative “weights,” or contributions, of each cluster to the averaged image at top. In addition to other facilities, the EHT network of radio observatories that made this image possible includes the Atacama Large Millimeter/submillimeter Array (ALMA) and the Atacama Pathfinder EXperiment (APEX) in the Atacama Desert in Chile, co-owned and co-operated by ESO is a partner on behalf of its member states in Europe. Credit: EHT Collaboration
In addition to other facilities, the EHT network of radio observatories includes the Atacama Large Millimeter/submillimeter Array (ALMA) and the Atacama Pathfinder EXperiment (APEX) in the Atacama Desert in Chile, co-owned and co-operated by ESO on behalf of its member states in Europe. Europe also contributes to the EHT observations with other radio observatories — the IRAM 30-meter telescope in Spain and, since 2018, the NOrthern Extended Millimeter Array (NOEMA) in France — as well as a supercomputer to combine EHT data hosted by the Max Planck Institute for Radio Astronomy in Germany. Moreover, Europe contributed with funding to the EHT consortium project through grants by the European Research Council and by the Max Planck Society in Germany.
This image shows the Atacama Large Millimeter/submillimeter Array (ALMA) looking up at the Milky Way as well as the location of Sagittarius A*, the supermassive black hole at our galactic centre. Highlighted in the box is the image of Sagittarius A* taken by the Event Horizon Telescope (EHT) Collaboration. Located in the Atacama Desert in Chile, ALMA is the most sensitive of all the observatories in the EHT array, and ESO is a co-owner of ALMA on behalf of its European Member States. Credit: ESO/José Francisco Salgado (josefrancisco.org), EHT Collaboration
“It is very exciting for ESO to have been playing such an important role in unravelling the mysteries of black holes, and of Sgr A* in particular, over so many years,” commented ESO Director General Xavier Barcons. “ESO not only contributed to the EHT observations through the ALMA and APEX facilities but also enabled, with its other observatories in Chile, some of the previous breakthrough observations of the Galactic centre.” [2]
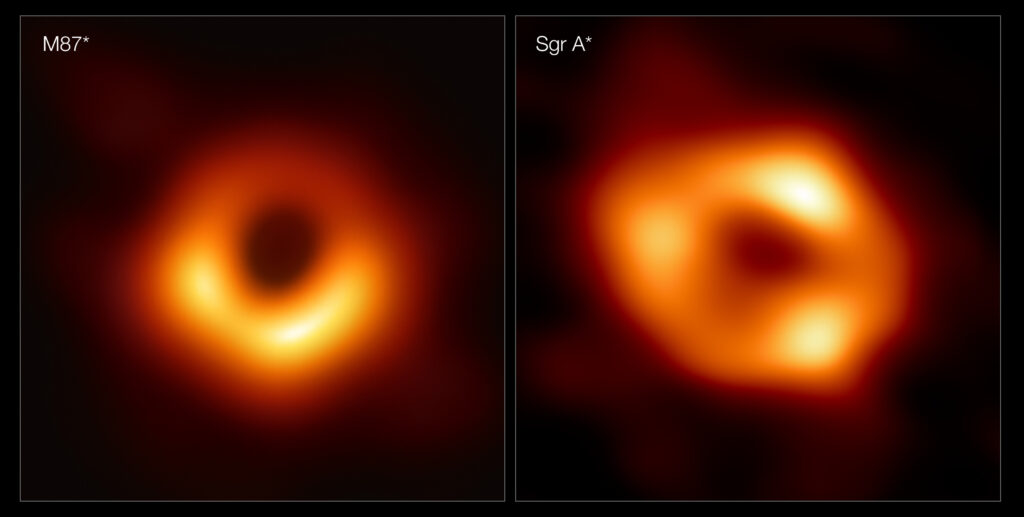
The EHT achievement follows the collaboration’s 2019 release of the first image of a black hole, called M87*, at the centre of the more distant Messier 87 galaxy.
These panels show the first two images ever taken of black holes. On the left is M87*, the supermassive black hole at the centre of the galaxy Messier 87 (M87), 55 million light-years away. On the right is Sagittarius A* (Sgr A*), the black hole at the centre of our Milky Way. The two images show the black holes as they would appear in the sky, with their bright rings appearing to be roughly the same size, despite M87* being around a thousand times larger than Sgr A*. The images were captured by the Event Horizon Telescope (EHT), a global network of radio telescopes including the Atacama Large Millimeter/submillimeter Array (ALMA) and Atacama Pathfinder EXperiment (APEX), in which ESO is co-owner. Credit: EHT Collaboration
The two black holes look remarkably similar, even though our galaxy’s black hole is more than a thousand times smaller and less massive than M87* [3].
“We have two completely different types of galaxies and two very different black hole masses, but close to the edge of these black holes they look amazingly similar,” says Sera Markoff, Co-Chair of the EHT Science Council and a professor of theoretical astrophysics at the University of Amsterdam, the Netherlands.
“This tells us that General Relativity governs these objects up close, and any differences we see further away must be due to differences in the material that surrounds the black holes.”
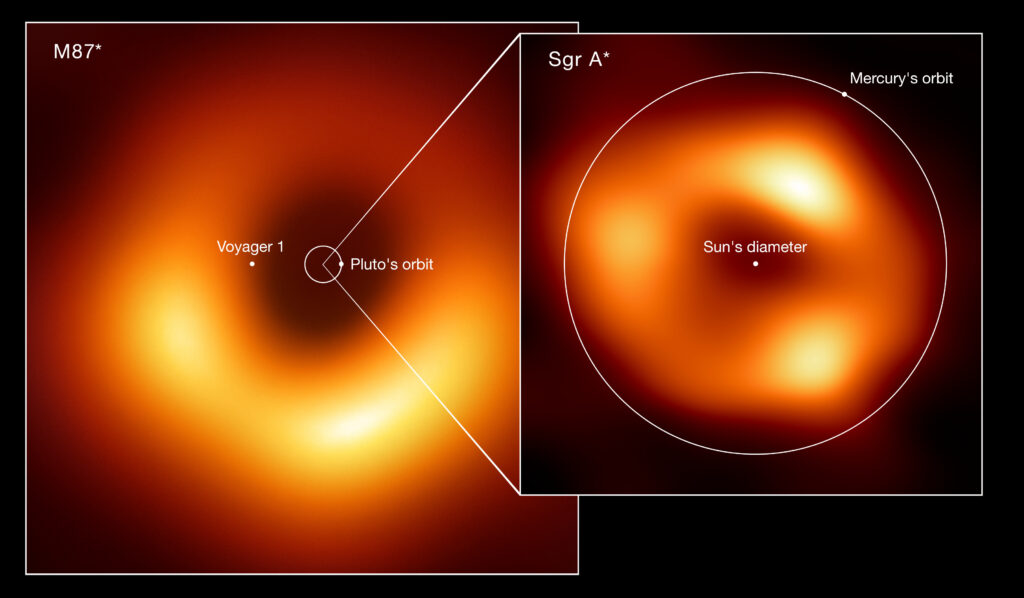
Size comparison of the two black holes imaged by the Event Horizon Telescope (EHT) Collaboration: M87*, at the heart of the galaxy Messier 87, and Sagittarius A* (Sgr A*), at the centre of the Milky Way. The image shows the scale of Sgr A* in comparison with both M87* and other elements of the Solar System such as the orbits of Pluto and Mercury. Also displayed is the Sun’s diameter and the current location of the Voyager 1 space probe, the furthest spacecraft from Earth. M87*, which lies 55 million light-years away, is one of the largest black holes known. While Sgr A*, 27 000 light-years away, has a mass roughly four million times the Sun’s mass, M87* is more than 1000 times more massive. Because of their relative distances from Earth, both black holes appear the same size in the sky. Credit: EHT collaboration (acknowledgment: Lia Medeiros, xkcd)
This achievement was considerably more difficult than for M87*, even though Sgr A* is much closer to us. EHT scientist Chi-kwan (‘CK’) Chan, from Steward Observatory and Department of Astronomy and the Data Science Institute of the University of Arizona, USA, explains:
“The gas in the vicinity of the black holes moves at the same speed — nearly as fast as light — around both Sgr A* and M87*. But where gas takes days to weeks to orbit the larger M87*, in the much smaller Sgr A* it completes an orbit in mere minutes. This means the brightness and pattern of the gas around Sgr A* were changing rapidly as the EHT Collaboration was observing it — a bit like trying to take a clear picture of a puppy quickly chasing its tail.”
The researchers had to develop sophisticated new tools that accounted for the gas movement around Sgr A*. While M87* was an easier, steadier target, with nearly all images looking the same, that was not the case for Sgr A*. The image of the Sgr A* black hole is an average of the different images the team extracted, finally revealing the giant lurking at the centre of our galaxy for the first time.
The effort was made possible through the ingenuity of more than 300 researchers from 80 institutes around the world that together make up the EHT Collaboration. In addition to developing complex tools to overcome the challenges of imaging Sgr A*, the team worked rigorously for five years, using supercomputers to combine and analyse their data, all while compiling an unprecedented library of simulated black holes to compare with the observations.
Scientists are particularly excited to finally have images of two black holes of very different sizes, which offers the opportunity to understand how they compare and contrast. They have also begun to use the new data to test theories and models of how gas behaves around supermassive black holes. This process is not yet fully understood but is thought to play a key role in shaping the formation and evolution of galaxies.
“Now we can study the differences between these two supermassive black holes to gain valuable new clues about how this important process works,” said EHT scientist Keiichi Asada from the Institute of Astronomy and Astrophysics, Academia Sinica, Taipei. “We have images for two black holes — one at the large end and one at the small end of supermassive black holes in the Universe — so we can go a lot further in testing how gravity behaves in these extreme environments than ever before.”
Progress on the EHT continues: a major observation campaign in March 2022 included more telescopes than ever before. The ongoing expansion of the EHT network and significant technological upgrades will allow scientists to share even more impressive images as well as movies of black holes in the near future.
This visible light wide-field view shows the rich star clouds in the constellation of Sagittarius (the Archer) in the direction of the centre of our Milky Way galaxy. The entire image is filled with vast numbers of stars — but far more remain hidden behind clouds of dust and are only revealed in infrared images. This view was created from photographs in red and blue light and form part of the Digitized Sky Survey 2. The field of view is approximately 3.5 degrees x 3.6 degrees. Credit:ESO and Digitized Sky Survey 2. Acknowledgment: Davide De Martin and S. Guisard (www.eso.org/~sguisard)
The black hole at the heart of our galaxy
Notes
[1] The individual telescopes involved in the EHT in April 2017, when the observations were conducted, were: the Atacama Large Millimeter/submillimeter Array (ALMA), the Atacama Pathfinder EXperiment (APEX), the IRAM 30-meter Telescope, the James Clerk Maxwell Telescope (JCMT), the Large Millimeter Telescope Alfonso Serrano (LMT), the Submillimeter Array (SMA), the UArizona Submillimeter Telescope (SMT), the South Pole Telescope (SPT). Since then, the EHT has added the Greenland Telescope (GLT), the NOrthern Extended Millimeter Array (NOEMA) and the UArizona 12-meter Telescope on Kitt Peak to its network.
ALMA is a partnership of the European Southern Observatory (ESO; Europe, representing its member states), the U.S. National Science Foundation (NSF), and the National Institutes of Natural Sciences (NINS) of Japan, together with the National Research Council (Canada), the Ministry of Science and Technology (MOST; Taiwan), Academia Sinica Institute of Astronomy and Astrophysics (ASIAA; Taiwan), and Korea Astronomy and Space Science Institute (KASI; Republic of Korea), in cooperation with the Republic of Chile. The Joint ALMA Observatory is operated by ESO, the Associated Universities, Inc./National Radio Astronomy Observatory (AUI/NRAO) and the National Astronomical Observatory of Japan (NAOJ). APEX, a collaboration between the Max Planck Institute for Radio Astronomy (Germany), the Onsala Space Observatory (Sweden) and ESO, is operated by ESO. The 30-meter Telescope is operated by IRAM (the IRAM Partner Organizations are MPG [Germany], CNRS [France] and IGN [Spain]). The JCMT is operated by the East Asian Observatory on behalf of The National Astronomical Observatory of Japan; ASIAA; KASI; the National Astronomical Research Institute of Thailand; the Center for Astronomical Mega-Science and organisations in the United Kingdom and Canada. The LMT is operated by INAOE and UMass, the SMA is operated by Center for Astrophysics | Harvard & Smithsonian and ASIAA and the UArizona SMT is operated by the University of Arizona. The SPT is operated by the University of Chicago with specialised EHT instrumentation provided by the University of Arizona.
The Greenland Telescope (GLT) is operated by ASIAA and the Smithsonian Astrophysical Observatory (SAO). The GLT is part of the ALMA-Taiwan project, and is supported in part by the Academia Sinica (AS) and MOST. NOEMA is operated by IRAM and the UArizona 12-meter telescope at Kitt Peak is operated by the University of Arizona.
A montage of the radio observatories that form the Event Horizon Telescope (EHT) network, used to image the Milky Way’s central black hole, Sagittarius A*. These include the Atacama Large Millimeter/submillimeter Array (ALMA), the Atacama Pathfinder EXperiment (APEX), IRAM 30-meter telescope, James Clark Maxwell Telescope (JCMT), Large Millimeter Telescope (LMT), Submillimeter Array (SMA), Submillimetere Telescope (SMT) and South Pole Telescope (SPT). The slightly transparent telescopes in the background, represent the three telescopes added to the EHT Collaboration after 2018: the Greenland Telescope, the NOrthern Extended Millimeter Array (NOEMA) in France, and the UArizona ARO 12-meter Telescope at Kitt Peak. These telescopes were added to the array after the 2017 observations of Sagittarius A*. Credit: ESO/M. Kornmesser. Images of individual telescopes: ALMA: ESO APEX: ESO LMT: INAOE Archives GLT: N. Patel JCMT: EAO-W. Montgomerie SMT: D. Harvey 30m: N. Billot SPT: Wikipedia SMA: S. R. Schimpf NOEMA: IRAM Kitt Peak: Wikipedia Milky Way: N. Risinger (skysurvey.org)A montage of the radio observatories that form the Event Horizon Telescope (EHT) network used to image the Milky Way’s central black hole, Sagittarius A*. These include the Atacama Large Millimeter/submillimeter Array (ALMA), the Atacama Pathfinder EXperiment (APEX), IRAM 30-meter telescope, James Clark Maxwell Telescope (JCMT), Large Millimeter Telescope (LMT), Submillimeter Array (SMA), Submillimeter Telescope (SMT) and South Pole Telescope (SPT). The slightly transparent telescopes in the background represent the three telescopes added to the EHT network after 2018: the Greenland Telescope, the NOrthern Extended Millimeter Array (NOEMA) in France, and the UArizona ARO 12-meter Telescope at Kitt Peak. These telescopes were added to the array after the 2017 observations of Sagittarius A*. Credit: ESO/M. Kornmesser. Images of individual telescopes: ALMA: ESO APEX: ESO LMT: INAOE Archives GLT: N. Patel JCMT: EAO-W. Montgomerie SMT: D. Harvey 30m: N. Billot SPT: Wikipedia SMA: S. R. Schimpf NOEMA: IRAM Kitt Peak: Wikipedia Milky Way: N. Risinger (skysurvey.org)
[2] A strong basis for the interpretation of this new image was provided by previous research carried out on Sgr A*. Astronomers have known the bright, dense radio source at the centre of the Milky Way in the direction of the constellation Sagittarius since the 1970s. By measuring the orbits of several stars very close to our galactic centre over a period of 30 years, teams led by Reinhard Genzel (Director at the Max –Planck Institute for Extraterrestrial Physics in Garching near Munich, Germany) and Andrea M. Ghez (Professor in the Department of Physics and Astronomy at the University of California, Los Angeles, USA) were able to conclude that the most likely explanation for an object of this mass and density is a supermassive black hole. ESO’s facilities (including the Very Large Telescope and the Very Large Telescope Interferometer) and the Keck Observatory were used to carry out this research, which shared the 2020 Nobel Prize in Physics.
[3] Black holes are the only objects we know of where mass scales with size. A black hole a thousand times smaller than another is also a thousand times less massive.
The black hole at the heart of our galaxy: more information
This research was presented in six papers published today in The Astrophysical Journal Letters.
A global map showing the radio observatories that form the Event Horizon Telescope (EHT) network used to image the Milky Way’s central black hole, Sagittarius A*. The telescopes highlighted in yellow were part of the EHT network during the observations of Sagittarius A* in 2017. These include the Atacama Large Millimeter/submillimeter Array (ALMA), the Atacama Pathfinder EXperiment (APEX), IRAM 30-meter telescope, James Clark Maxwell Telescope (JCMT), Large Millimeter Telescope (LMT), Submillimeter Array (SMA), Submillimetere Telescope (SMT) and South Pole Telescope (SPT). Highlighted in blue are the three telescopes added to the EHT Collaboration after 2018: the Greenland Telescope, the NOrthern Extended Millimeter Array (NOEMA) in France, and the UArizona ARO 12-meter Telescope at Kitt Peak. Credit:ESO/M. Kornmesser
The EHT collaboration involves more than 300 researchers from Africa, Asia, Europe, North and South America. The international collaboration aims to capture the most detailed black hole images ever obtained by creating a virtual Earth-sized telescope. Supported by considerable international efforts, the EHT links existing telescopes using novel techniques — creating a fundamentally new instrument with the highest angular resolving power that has yet been achieved.
This image shows the locations of some of the telescopes making up the EHT, as well as a representation of the long baselines between the telescopes. Credit:ESO/L. Calçada
The EHT consortium consists of 13 stakeholder institutes; the Academia Sinica Institute of Astronomy and Astrophysics, the University of Arizona, the Center for Astrophysics | Harvard & Smithsonian, the University of Chicago, the East Asian Observatory, Goethe-Universitaet Frankfurt, Institut de Radioastronomie Millimétrique, Large Millimeter Telescope, Max Planck Institute for Radio Astronomy, MIT Haystack Observatory, National Astronomical Observatory of Japan, Perimeter Institute for Theoretical Physics, and Radboud University.
This view shows several of the ALMA antennas and the central regions of the Milky Way above. In this wide field view, the zodiacal light is seen upper right and at lower left Mars is seen. Saturn is a bit higher in the sky towards the centre of the image. The image was taken during the ESO Ultra HD (UHD) Expedition. Credit:ESO/B. Tafreshi (twanight.org)
The Atacama Large Millimeter/submillimeter Array (ALMA), an international astronomy facility, is a partnership of ESO, the U.S. National Science Foundation (NSF) and the National Institutes of Natural Sciences (NINS) of Japan in cooperation with the Republic of Chile. ALMA is funded by ESO on behalf of its Member States, by NSF in cooperation with the National Research Council of Canada (NRC) and the Ministry of Science and Technology (MOST) and by NINS in cooperation with the Academia Sinica (AS) in Taiwan and the Korea Astronomy and Space Science Institute (KASI). ALMA construction and operations are led by ESO on behalf of its Member States; by the National Radio Astronomy Observatory (NRAO), managed by Associated Universities, Inc. (AUI), on behalf of North America; and by the National Astronomical Observatory of Japan (NAOJ) on behalf of East Asia. The Joint ALMA Observatory (JAO) provides the unified leadership and management of the construction, commissioning and operation of ALMA.
The slumbering Atacama Pathfinder Experiment (APEX) telescope sits beneath reddened skies amongst the snow covered Chajnantor landscape. Snow not only blankets the ground, but also the many peaks that encircle the Chilean plateau which also hosts the Atacama Large Millimeter/submillimeter Array (ALMA). Credit:Carlos A. Durán/ESO
APEX, Atacama Pathfinder EXperiment, is a 12-metre diameter telescope, operating at millimetre and submillimetre wavelengths — between infrared light and radio waves. ESO operates APEX at one of the highest observatory sites on Earth, at an elevation of 5100 metres, high on the Chajnantor plateau in Chile’s Atacama region. The telescope is a collaboration between the Max Planck Institute for Radio Astronomy (MPIfR), the Onsala Space Observatory (OSO), and ESO.
This image shows the dish of the Atacama Pathfinder Experiment (APEX) telescope seen perfectly from the side, including the starry sky. Credit:C. Duran/ESOESO Photo Ambassador Stéphane Guisard captured this astounding panorama from the site of ALMA, the Atacama Large Millimeter/submillimeter Array, in the Chilean Andes. The 5000-metre-high and extremely dry Chajnantor plateau offers the perfect place for this state-of-the-art telescope, which studies the Universe in millimetre- and submillimetre-wavelength light. Numerous giant antennas dominate the centre of the image. When ALMA is complete, it will have a total of 54 of these 12-metre-diameter dishes. Above the array, the arc of the Milky Way serves as a resplendent backdrop. When the panorama was taken, the Moon was lying close to the centre of the Milky Way in the sky, its light bathing the antennas in an eerie night-time glow. The Large and Small Magellanic Clouds, the biggest of the Milky Way’s dwarf satellite galaxies, appear as two luminous smudges in the sky on the left. A particularly bright meteor streak gleams near the Small Magellanic Cloud. On the right, some of ALMA’s smaller 7-metre antennas — twelve of which will be used to form the Atacama Compact Array — can be seen. Still further on the right shine the lights of the Array Operations Site Technical Building. And finally, looming behind this building is the dark, mountainous peak of Cerro Chajnantor. ALMA, an international astronomy facility, is a partnership of Europe, North America and East Asia in cooperation with the Republic of Chile. ALMA construction and operations are led on behalf of Europe by ESO, on behalf of North America by the National Radio Astronomy Observatory (NRAO), and on behalf of East Asia by the National Astronomical Observatory of Japan (NAOJ). The Joint ALMA Observatory (JAO) provides the unified leadership and management of the construction, commissioning and operation of ALMA. Links ESO Photo Ambassadors More about ALMA at ESO The Joint ALMA Observatory. Links ESO Photo Ambassadors More about ALMA at ESO The Joint ALMA Observatory Credit:ESO/S. Guisard (www.eso.org/~sguisard)
The European Southern Observatory (ESO) enables scientists worldwide to discover the secrets of the Universe for the benefit of all. We design, build and operate world-class observatories on the ground — which astronomers use to tackle exciting questions and spread the fascination of astronomy — and promote international collaboration in astronomy. Established as an intergovernmental organisation in 1962, today ESO is supported by 16 Member States (Austria, Belgium, the Czech Republic, Denmark, France, Finland, Germany, Ireland, Italy, the Netherlands, Poland, Portugal, Spain, Sweden, Switzerland and the United Kingdom), along with the host state of Chile and with Australia as a Strategic Partner. ESO’s headquarters and its visitor centre and planetarium, the ESO Supernova, are located close to Munich in Germany, while the Chilean Atacama Desert, a marvellous place with unique conditions to observe the sky, hosts our telescopes. ESO operates three observing sites: La Silla, Paranal and Chajnantor. At Paranal, ESO operates the Very Large Telescope and its Very Large Telescope Interferometer, as well as two survey telescopes, VISTA working in the infrared and the visible-light VLT Survey Telescope. Also at Paranal ESO will host and operate the Cherenkov Telescope Array South, the world’s largest and most sensitive gamma-ray observatory. Together with international partners, ESO operates APEX and ALMA on Chajnantor, two facilities that observe the skies in the millimetre and submillimetre range. At Cerro Armazones, near Paranal, we are building “the world’s biggest eye on the sky” — ESO’s Extremely Large Telescope. From our offices in Santiago, Chile we support our operations in the country and engage with Chilean partners and society.
The black hole at the heart of our galaxy. This is the first image of Sgr A*, the supermassive black hole at the centre of our galaxy, with an added black background to fit wider screens. It’s the first direct visual evidence of the presence of this black hole. It was captured by the Event Horizon Telescope (EHT), an array which linked together eight existing radio observatories across the planet to form a single “Earth-sized” virtual telescope. The telescope is named after the event horizon, the boundary of the black hole beyond which no light can escape. Although we cannot see the event horizon itself, because it cannot emit light, glowing gas orbiting around the black hole reveals a telltale signature: a dark central region (called a shadow) surrounded by a bright ring-like structure. The new view captures light bent by the powerful gravity of the black hole, which is four million times more massive than our Sun. The image of the Sgr A* black hole is an average of the different images the EHT Collaboration has extracted from its 2017 observations. In addition to other facilities, the EHT network of radio observatories that made this image possible includes the Atacama Large Millimeter/submillimeter Array (ALMA) and the Atacama Pathfinder EXperiment (APEX) in the Atacama Desert in Chile, co-owned and co-operated by ESO is a partner on behalf of its member states in Europe. Credit:EHT Collaboration
Rocks on floor of Jezero Crater, Mars, show signs of sustained interactions with water
Rocks on floor of Jezero Crater, Mars, show signs of sustained interactions with water. Perseverance rover taking a selfie over the rock it collected two core samples from on Mars. Perseverance rover taking a selfie over the rock it collected two core samples from on Mars. Image credit NASA/JPL-Caltech/MSSS
Portland, Ore., USA:Since the Perseverance rover landed in Jezero crater on Mars in February, the rover and its team of scientists back on Earth have been hard at work exploring the floor of the crater that once held an ancient lake. Perseverance and the Mars 2020 mission are looking for signs of ancient life on Mars and preparing a returnable cache of samples for later analyses on Earth.
Katie Stack Morgan is the Mars 2020 Deputy Project Scientist and a research scientist at NASA’s Jet Propulsion Laboratory (JPL), and will be providing an update on early results on the Mars 2020 rover mission on Sunday, 10 Oct., at the Geological Society of America’s Connects 2021 annual meeting in Portland, Oregon.
With Perseverance’s high-tech suite of on-board instruments, the scientific team has been analyzing the rocks of the crater floor, interpreted for now as igneous rocks, presumably a volcanic lava flow.
“The idea that this could be a volcanic rock was really appealing to us from a sample return perspective because igneous rocks are great for getting accurate age dates. Jezero was one of the few ancient crater lake sites on Mars that seemed to have both incredible sedimentary deposits as well as volcanic deposits that could help us construct the geologic time scale of Mars,” said Stack Morgan.
The lake system and rivers that drained into Jezero crater were likely active around 3.8–3.6 billion years ago, but the ability to directly date the age of the rocks in laboratories on Earth will provide the first definitive insight into the window of time that Mars may have been a habitable planet.
Using Perseverance’s abrasion tool—which scratches the top surface of the rock to reveal the rock and its textures—the team discovered that the crater floor seems to be composed of coarser-grained igneous minerals, and there are also a variety of salts in the rocks. Observations suggest that water caused extensive weathering and alteration of the crater floor, meaning that the rocks were subjected to water for a significant duration of time.
After using its on-board tools to analyze characteristics of the crater floor, the next phase was for Perseverance to collect a rock sample using its drill feature. However, after Perseverance completed its first attempt at drilling, the core sample tube came up empty.
“We spent a couple of days looking around the rover thinking that the core might have fallen out of the bit. Then we looked back down the drill hole thinking it might never have made it out of the hole. All these searches turned up empty. In the end we concluded that the core was pulverized during drilling,” said Stack Morgan.
The rock likely became so altered and weakened from interactions with water that the vibrations and strength from the Perseverance drill pulverized the sample.
Scientists then targeted another rock that appeared more resistant to weathering, and Perseverance was able to successfully collect two core samples—the first in its sample collection. Perseverance’s cache of samples will be part of a multi-spacecraft handoff, still in development, that will hopefully be returned to Earth in the early 2030s. From there, scientists in laboratories on Earth will date and analyze the rocks to see if there might be any signs of ancient Martian life.
“The rocks of the crater floor were not originally envisioned as the prime astrobiology target of the mission, but Mars always surprises us when we look up close. We are excited to find that even these rocks have experienced sustained interaction with water and could have been habitable for ancient martian microbes,” said Stack Morgan.
First results from Fermilab’s Muon g-2 experiment strengthen evidence of new physics
The long-awaited first results from the Muon g-2 experiment at the U.S. Department of Energy’s Fermi National Accelerator Laboratory show fundamental particles called muons behaving in a way that is not predicted by scientists’ best theory, the Standard Model of particle physics. This landmark result, made with unprecedented precision, confirms a discrepancy that has been gnawing at researchers for decades.
The strong evidence that muons deviate from the Standard Model calculation might hint at exciting new physics. Muons act as a window into the subatomic world and could be interacting with yet undiscovered particles or forces.
“Today is an extraordinary day, long awaited not only by us but by the whole international physics community,” said Graziano Venanzoni, co-spokesperson of the Muon g-2 experiment and physicist at the Italian National Institute for Nuclear Physics. “A large amount of credit goes to our young researchers who, with their talent, ideas and enthusiasm, have allowed us to achieve this incredible result.”
First results from the Muon g-2 experiment at Fermilab have strengthened evidence of new physics. The centerpiece of the experiment is a 50-foot-diameter superconducting magnetic storage ring, which sits in its detector hall amidst electronics racks, the muon beamline, and other equipment. This impressive experiment operates at negative 450 degrees Fahrenheit and studies the precession (or wobble) of muons as they travel through the magnetic field. Photo: Reidar Hahn, Fermilab
A muon is about 200 times as massive as its cousin, the electron. Muons occur naturally when cosmic rays strike Earth’s atmosphere, and particle accelerators at Fermilab can produce them in large numbers. Like electrons, muons act as if they have a tiny internal magnet. In a strong magnetic field, the direction of the muon’s magnet precesses, or wobbles, much like the axis of a spinning top or gyroscope. The strength of the internal magnet determines the rate that the muon precesses in an external magnetic field and is described by a number that physicists call the g-factor. This number can be calculated with ultra-high precision.
As the muons circulate in the Muon g-2 magnet, they also interact with a quantum foam of subatomic particles popping in and out of existence. Interactions with these short-lived particles affect the value of the g-factor, causing the muons’ precession to speed up or slow down very slightly. The Standard Model predicts this so-called anomalous magnetic moment extremely precisely. But if the quantum foam contains additional forces or particles not accounted for by the Standard Model, that would tweak the muon g-factor further.
“This quantity we measure reflects the interactions of the muon with everything else in the universe. But when the theorists calculate the same quantity, using all of the known forces and particles in the Standard Model, we don’t get the same answer,” said Renee Fatemi, a physicist at the University of Kentucky and the simulations manager for the Muon g-2 experiment. “This is strong evidence that the muon is sensitive to something that is not in our best theory.”
The predecessor experiment at DOE’s Brookhaven National Laboratory, which concluded in 2001, offered hints that the muon’s behavior disagreed with the Standard Model. The new measurement from the Muon g-2 experiment at Fermilab strongly agrees with the value found at Brookhaven and diverges from theory with the most precise measurement to date.
The first result from the Muon g-2 experiment at Fermilab confirms the result from the experiment performed at Brookhaven National Lab two decades ago. Together, the two results show strong evidence that muons diverge from the Standard Model prediction. Image: Ryan Postel, Fermilab/Muon g-2 collaboration
The accepted theoretical values for the muon are:
g-factor: 2.00233183620(86)
anomalous magnetic moment: 0.00116591810(43)
[uncertainty in parentheses]
The new experimental world-average results announced by the Muon g-2 collaboration today are:
g-factor: 2.00233184122(82)
anomalous magnetic moment: 0.00116592061(41)
The combined results from Fermilab and Brookhaven show a difference with theory at a significance of 4.2 sigma, a little shy of the 5 sigma (or standard deviations) that scientists require to claim a discovery but still compelling evidence of new physics. The chance that the results are a statistical fluctuation is about 1 in 40,000.
The Fermilab experiment reuses the main component from the Brookhaven experiment, a 50-foot-diameter superconducting magnetic storage ring. In 2013, it was transported 3,200 miles by land and sea from Long Island to the Chicago suburbs, where scientists could take advantage of Fermilab’s particle accelerator and produce the most intense beam of muons in the United States. Over the next four years, researchers assembled the experiment; tuned and calibrated an incredibly uniform magnetic field; developed new techniques, instrumentation, and simulations; and thoroughly tested the entire system.
Thousands of people welcomed the Muon g-2 magnet to Fermilab in 2013. Data from the experiment’s first run has yielded a result with unprecedented precision. Data from four additional experimental runs will reveal the muon’s behavior in even more detail. Photo: Reidar Hahn, Fermilab
The Muon g-2 experiment sends a beam of muons into the storage ring, where they circulate thousands of times at nearly the speed of light. Detectors lining the ring allow scientists to determine how fast the muons are precessing.
In its first year of operation, in 2018, the Fermilab experiment collected more data than all prior muon g-factor experiments combined. With more than 200 scientists from 35 institutions in seven countries, the Muon g-2 collaboration has now finished analyzing the motion of more than 8 billion muons from that first run.
“After the 20 years that have passed since the Brookhaven experiment ended, it is so gratifying to finally be resolving this mystery,” said Fermilab scientist Chris Polly, who is a co-spokesperson for the current experiment and was a lead graduate student on the Brookhaven experiment.
Data analysis on the second and third runs of the experiment is under way, the fourth run is ongoing, and a fifth run is planned. Combining the results from all five runs will give scientists an even more precise measurement of the muon’s wobble, revealing with greater certainty whether new physics is hiding within the quantum foam.
“So far we have analyzed less than 6% of the data that the experiment will eventually collect. Although these first results are telling us that there is an intriguing difference with the Standard Model, we will learn much more in the next couple of years,” Polly said.
“Pinning down the subtle behavior of muons is a remarkable achievement that will guide the search for physics beyond the Standard Model for years to come,” said Fermilab Deputy Director of Research Joe Lykken. “This is an exciting time for particle physics research, and Fermilab is at the forefront.”
Press release from the Fermilab; first results from Fermilab’s Muon g-2 experiment strengthen evidence of new physics.
Hubble sees new atmosphere forming on a rocky exoplanet, GJ 1132 b
The planet GJ 1132 b appears to have begun life as a gaseous world with a thick blanket of atmosphere. Starting out at several times the radius of Earth, this so-called “sub-Neptune” quickly lost its primordial hydrogen and helium atmosphere, which was stripped away by the intense radiation from its hot, young star. In a short period of time, it was reduced to a bare core about the size of Earth.
This image is an artist’s impression of the exoplanet GJ 1132 b. For the first time, scientists using the NASA/ESA Hubble Space Telescope have found evidence of volcanic activity reforming the atmosphere on this rocky planet, which has a similar density, size, and age to that of Earth. To the surprise of astronomers, new observations from Hubble have uncovered a second atmosphere that has replaced the planet’s first atmosphere. It is rich in hydrogen, hydrogen cyanide, methane and ammonia, and also has a hydrocarbon haze. Astronomers theorise that hydrogen from the original atmosphere was absorbed into the planet’s molten magma mantle and is now being slowly released by volcanism to form a new atmosphere. This second atmosphere, which continues to leak away into space, is continually being replenished from the reservoir of hydrogen in the mantle’s magma. Credit: NASA, ESA, and R. Hurt (IPAC/Caltech), CC BY 4.0
To the surprise of astronomers, new observations from Hubble [1] have uncovered a secondary atmosphere that has replaced the planet’s first atmosphere. It is rich in hydrogen, hydrogen cyanide, methane and ammonia, and also has a hydrocarbon haze. Astronomers theorise that hydrogen from the original atmosphere was absorbed into the planet’s molten magma mantle and is now being slowly released by volcanism to form a new atmosphere. This second atmosphere, which continues to leak away into space, is continually being replenished from the reservoir of hydrogen in the mantle’s magma.
“This second atmosphere comes from the surface and interior of the planet, and so it is a window onto the geology of another world,” explained team member Paul Rimmer of the University of Cambridge, UK. “A lot more work needs to be done to properly look through it, but the discovery of this window is of great importance.”
Pictured here is the region around the host star of the exoplanet GJ 1132 b. Credit: ESA/Hubble, Digitized Sky Survey 2, CC BY 4.0. Acknowledgement: Davide De Martin
“We first thought that these highly radiated planets would be pretty boring because we believed that they lost their atmospheres,” said team member Raissa Estrela of the Jet Propulsion Laboratory at the California Institute of Technology in Pasadena, California, USA. But we looked at existing observations of this planet with Hubble and realised that there is an atmosphere there.”
“How many terrestrial planets don’t begin as terrestrials? Some may start as sub-Neptunes, and they become terrestrials through a mechanism whereby light evaporates the primordial atmosphere. This process works early in a planet’s life, when the star is hotter,” said team leader Mark Swain of the Jet Propulsion Laboratory. “Then the star cools down and the planet’s just sitting there. So you’ve got this mechanism that can cook off the atmosphere in the first 100 million years, and then things settle down. And if you can regenerate the atmosphere, maybe you can keep it.”
In some ways, GJ 1132 b has various parallels to Earth, but in some ways it is also very different. Both have similar densities, similar sizes, and similar ages, being about 4.5 billion years old. Both started with a hydrogen-dominated atmosphere, and both were hot before they cooled down. The team’s work even suggests that GJ 1132 b and Earth have similar atmospheric pressure at the surface.
This plot shows the spectrum of the atmosphere of an Earth sized rocky exoplanet, GJ 1132 b, which is overlaid on an artist’s impression of the planet. The orange line represents the model spectrum. In comparison, the observed spectrum is shown as blue dots representing averaged data points, along with their error bars. This analysis is consistent with GJ 1132 b being predominantly a hydrogen atmosphere with a mix of methane and hydrogen cyanide. The planet also has aerosols which cause scattering of light. This is the first time a so-called “secondary atmosphere,” which was replenished after the planet lost its primordial atmosphere, has been detected on a world outside of our solar system. Credit: NASA, ESA, and P. Jeffries (STScI)
However, the planets’ formation histories are profoundly different. Earth is not believed to be the surviving core of a sub-Neptune. And Earth orbits at a comfortable distance from our yellow dwarf Sun. GJ 1132 b is so close to its host red dwarf star that it completes an orbit the star once every day and a half. This extremely close proximity keeps GJ 1132 b tidally locked, showing the same face to its star at all times — just as our moon keeps one hemisphere permanently facing Earth.
“The question is, what is keeping the mantle hot enough to remain liquid and power volcanism?” asked Swain. “This system is special because it has the opportunity for quite a lot of tidal heating.”
The phenomenon of tidal heating occurs through friction, when energy from a planet’s orbit and rotation is dispersed as heat inside the planet. GJ 1132 b is in an elliptical orbit, and the tidal forces acting on it are strongest when it is closest to or farthest from its host star. At least one other planet in the host star’s system also exerts a gravitational pull on the planet. The consequences are that the planet is squeezed or stretched by this gravitational “pumping.” That tidal heating keeps the mantle liquid for a long time. A nearby example in our own Solar System is the Jovian moon, Io, which has continuous volcanism as a result of a tidal tug-of-war between Jupiter and the neighbouring Jovian moons.
The team believes the crust of GJ 1132 b is extremely thin, perhaps only hundreds of feet thick. That’s much too feeble to support anything resembling volcanic mountains. Its flat terrain may also be cracked like an eggshell by tidal flexing. Hydrogen and other gases could be released through such cracks.
“This atmosphere, if it’s thin — meaning if it has a surface pressure similar to Earth — probably means you can see right down to the ground at infrared wavelengths. That means that if astronomers use the James Webb Space Telescope to observe this planet, there’s a possibility that they will see not the spectrum of the atmosphere, but rather the spectrum of the surface,” explained Swain. “And if there are magma pools or volcanism going on, those areas will be hotter. That will generate more emission, and so they’ll potentially be looking at the actual geological activity — which is exciting!”
This result is significant because it gives exoplanet scientists a way to figure out something about a planet’s geology from its atmosphere,” added Rimmer. “It is also important for understanding where the rocky planets in our own Solar System — Mercury, Venus, Earth and Mars, fit into the bigger picture of comparative planetology, in terms of the availability of hydrogen versus oxygen in the atmosphere.”
###
Notes:
[1] The observations were conducted as part of the Hubble observing program #14758 (PI: Zach Berta-Thomson).
Saturn is truly the lord of the rings in this latest snapshot from NASA’s Hubble Space Telescope, taken on July 4, 2020, when the opulent giant world was 839 million miles from Earth. This new Saturn image was taken during summer in the planet’s northern hemisphere.
NASA’s Hubble Space Telescope captured this image of Saturn on July 4, 2020. Two of Saturn’s icy moons are clearly visible in this exposure: Mimas at right, and Enceladus at bottom. This image is taken as part of the Outer Planets Atmospheres Legacy (OPAL) project. OPAL is helping scientists understand the atmospheric dynamics and evolution of our solar system’s gas giant planets. In Saturn’s case, astronomers continue tracking shifting weather patterns and storms. Credits: NASA, ESA, A. Simon (Goddard Space Flight Center), M.H. Wong (University of California, Berkeley), and the OPAL Team
Hubble found a number of small atmospheric storms. These are transient features that appear to come and go with each yearly Hubble observation. The banding in the northern hemisphere remains pronounced as seen in Hubble’s 2019 observations, with several bands slightly changing color from year to year. The ringed planet’s atmosphere is mostly hydrogen and helium with traces of ammonia, methane, water vapor, and hydrocarbons that give it a yellowish-brown color.
Hubble photographed a slight reddish haze over the northern hemisphere in this color composite. This may be due to heating from increased sunlight, which could either change the atmospheric circulation or perhaps remove ices from aerosols in the atmosphere. Another theory is that the increased sunlight in the summer months is changing the amounts of photochemical haze produced. “It’s amazing that even over a few years, we’re seeing seasonal changes on Saturn,” said lead investigator Amy Simon of NASA’s Goddard Space Flight Center in Greenbelt, Maryland. Conversely, the just-now-visible south pole has a blue hue, reflecting changes in Saturn’s winter hemisphere.
Hubble’s sharp view resolves the finely etched concentric ring structure. The rings are mostly made of pieces of ice, with sizes ranging from tiny grains to giant boulders. Just how and when the rings formed remains one of our solar system’s biggest mysteries. Conventional wisdom is that they are as old as the planet, over 4 billion years. But because the rings are so bright – like freshly fallen snow – a competing theory is that they may have formed during the age of the dinosaurs. Many astronomers agree that there is no satisfactory theory that explains how rings could have formed within just the past few hundred million years. “However, NASA’s Cassini spacecraft measurements of tiny grains raining into Saturn’s atmosphere suggest the rings can only last for 300 million more years, which is one of the arguments for a young age of the ring system,” said team member Michael Wong of the University of California, Berkeley.
Two of Saturn’s icy moons are clearly visible in this exposure: Mimas at right, and Enceladus at bottom.
This image is taken as part of the Outer Planets Atmospheres Legacy (OPAL) project. OPAL is helping scientists understand the atmospheric dynamics and evolution of our solar system’s gas giant planets. In Saturn’s case, astronomers continue tracking shifting weather patterns and storms.
The Hubble Space Telescope is a project of international cooperation between NASA and ESA (European Space Agency). NASA’s Goddard Space Flight Center in Greenbelt, Maryland, manages the telescope. The Space Telescope Science Institute (STScI) in Baltimore conducts Hubble science operations. STScI is operated for NASA by the Association of Universities for Research in Astronomy in Washington, D.C.
Press release from NASA, on Hubble capturing summertime data from Saturn.
Heat stress: the climate is putting European forests under sustained pressure
No year since weather records began was as hot and dry as 2018. A first comprehensive analysis of the consequences of this drought and heat event shows that central European forests sustained long-term damage. Even tree species considered drought-resistant, such as beech, pine and silver fir, suffered. The international study was directed by the University of Basel, which is conducting a forest experiment unique in Europe.
In a forest near Basel researchers study the effects of climate change on the most important and sensitive part of the trees – the canopy. A total of 450 trees between 50 and 120 years old grow on the 1.6 hectare research area. Credits: University of Basel
Until now, 2003 has been the driest and hottest year since regular weather records began. That record has now been broken. A comparison of climate data from Germany, Austria and Switzerland shows that 2018 was significantly warmer. The average temperature during the vegetation period was 1.2°C above the 2003 value and as high as 3.3°C above the average of the years from 1961 to 1990.
Part of the analysis, which has now been published, includes measurements taken at the Swiss Canopy Crane II research site in Basel, where extensive physiological investigations were carried out in tree canopies. The goal of these investigations is to better understand how and when trees are affected by a lack of water in order to counter the consequences of climate change through targeted management measures.
When trees die of thirst
Trees lose a lot of water through their surfaces. If the soil also dries out, the tree cannot replace this water, which is shown by the negative suction tension in the wood’s vascular tissue. It’s true that trees can reduce their water consumption, but if the soil water reservoir is used up, it’s ultimately only a matter of time until cell dehydration causes the death of a tree.
Physiological measurements at the Basel research site have shown the researchers that the negative suction tension and water shortage in trees occurred earlier than usual. In particular, this shortage was more severe throughout all of Germany, Austria and Switzerland than ever measured before. Over the course of the summer, severe drought-related stress symptoms therefore appeared in many tree species important to forestry. Leaves wilted, aged and were shed prematurely.
Death of a beech tree in a forest near Basel: during the 2018 heatwave the leaves died prematurely, the following year the tree stopped forming new shoots. Credits: Urs Weber, University of Basel
Spruce, pine and beech most heavily affected
The true extent of the summer heatwave became evident in 2019: many trees no longer formed new shoots – they were partially or wholly dead. Others had survived the stress of the drought and heat of the previous year, but were increasingly vulnerable to bark beetle infestation or fungus. Trees with partially dead canopies, which reduced the ability to recover from the damage, were particularly affected.
“Spruce was most heavily affected. But it was a surprise for us that beech, silver fir and pine were also damaged to this extent,” says lead researcher Professor Ansgar Kahmen. Beech in particular had until then been classified as the “tree of the future”, although its supposed drought resistance has been subject to contentious discussion since the 2003 heatwave.
Death of a beech tree in a forest near Basel: during the 2018 heatwave the leaves died prematurely, the following year the tree stopped foring new shoots. Credits: Urs Weber, University of Basel
Future scenarios to combat heat and drought
According to the latest projections, precipitation in Europe will decline by up to a fifth by 2085, and drought and heat events will become more frequent. Redesigning forests is therefore essential. “Mixed woodland is often propagated,” explains plant ecologist Kahmen, “and it certainly has many ecological and economic advantages. But whether mixed woodland is also more drought-resistant has not yet been clearly proven. We still need to study which tree species are good in which combinations, including from a forestry perspective. That will take a long time.”
Another finding of the study is that it is only possible to record the impacts of extreme climate events on European forests to a limited extent using conventional methods, and thus new analytical approaches are needed.“The damage is obvious. More difficult is precisely quantifying it and drawing the right conclusions for the future,” says Kahmen. Earth observation data from satellites could help track tree mortality on a smaller scale. Spatial patterns that contain important ecological and forestry-related information can be derived from such data: which tree species were heavily impacted, when and at which locations, and which survived without damage? “A system like this already exists in some regions in the US, but central Europe still lacks one.”
Original source
Schuldt, Bernhard & Buras, Allan & Arend, Matthias & Vitasse, Yann & Beierkuhnlein, Carl & Damm, Alexander & Gharun, Mana & Grams, Thorsten & Hauck, Markus & Hajek, Peter & Hartmann, Henrik & Hilbrunner, Erika & Hoch, Günter & Holloway-Phillips, Meisha & Körner, Christian & Larysch, Elena & Luebbe, Torben & Nelson, Daniel & Rammig, Anja & Kahmen, Ansgar.
At 7:30 am of May 18th, 1980, Don Swanson of USGS claimed that “the bulge still bulges”. The weird bulge grown on the northern flank of Mount St. Helens in the past weeks was still there; since days there were warning signs of a possible eruption. It would have begun exactly one hour later.
To remember the events that brought to the eruptive event, the USGS (U.S.Geological Survey) reported an accurate day-by-day chronicle of what happened fourty years ago on its Facebook page. Pictures and fascinating memories, exclusive video recordings, curiosities and details that had gone lost through time. A brief geological history of the volcano is presented here, from its origins until the day of the eruption. For more insights, we also suggest the reading of the chronicle on Facebook and the USGS scientist Richard Waitt’s bookIn the Path of Destruction: Eyewitness Chronicles of Mount St. Helens.
The stratovolcano
Mount St. Helens is an active stratovolcano, part of the Cascade Range volcanic arch (Cascades, State of Washington, USA), North-American section of the Pacific Ring of Fire. A volcanic arch forms by magma rising in proximity of subduction zones, i.e. when a tectonic plate (oceanic in this case) moves under a continental one. The descend of a fluid-rich crust into the mantle reaching increasing pressure and temperature creates instability, resulting in the rise of melted material towards the surface. The tectonic movements of the Pacific and surrounding plates generated several subduction zones and volcanic arches along the so-called Ring of Fire.
The Ring of Fire surrounding the Pacific Ocean and location of Mount St. Helens, vectorial by Gringer, public domain
The magmatism by subduction usually originates at 100 km depth, since certain pressure and temperature conditions are necessary for the material to start melting and rising. However, Mount St. Helens is oddly located at only 67 km above the subduction zone. The results of the iMUSH (Imaging Magma Under St. Helens) research suggest that the volcano might seat above a cold magmatic rocks wedge (serpentinite) originating when the mantle reacts with oceanic water. The source of magmatims would be instead located eastward, under other volcanoes of the same chain. According to the research, the magma would migrate laterally feeding the Mount St. Helens eruptions.
The Geological history
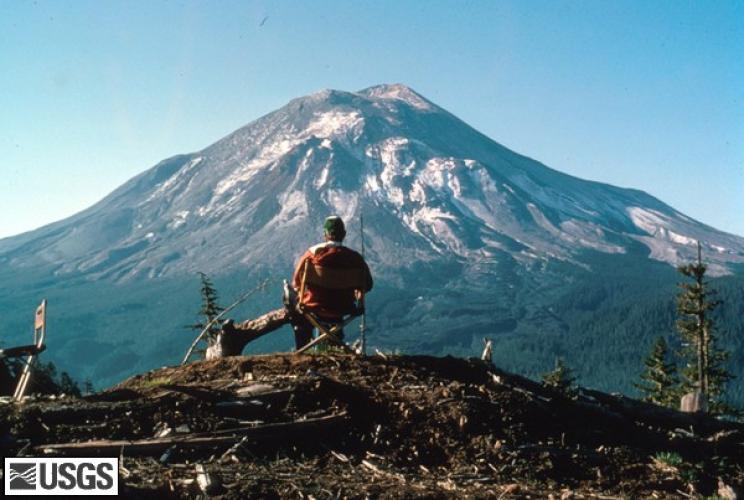
The structure of a stratovolcano is originated by overlapping products emitted during its eruptive history. The shape of Mount St. Helens before the 1980 eruption was finalized during the Spirit Lake stage (Holocene, 3900 years – present day). The stage is divided in six eruptive periods: Smith Creek, Pine Creek, Castle Creek, Sugar Bowl, Kalama, Goat Rocks and the Modern one, begun with the 1980 activity. These periods were characterized mainly by explosive eruptions, proved by oldest products. The most significant event occurred during the Kalama period with the growth of the dome at the summit. This shaped the final volcano appearance. It took 100 years for the dome to grow and after the 1720 eruption it reached 1800 m above the sea level. At this altitude, an ice cap started covering the summit. The volcano remained quiet until mid-March 1980.
On March 20th 1980, after sleeping 123 years, a 4.2 degree Richter earthquake was registered in the volcanic area. It happened after days of weaker tremors, its hypocenter (the origin point inside Earth) was shallow. During the following days, the instruments recorded low magnitude seismic swarms, not perceived by humans. The USGS experts struggled to define the origin of the earthquakes (tectonic or volcanic), nor they could say if or when an eruption would occur.
The volcanic activity started on March 27th: thanks to an areal view the experts identified a 70 m wide newborn crater in the ice and a plume rising up to 2 km. Moreover, they mapped two East-West fracture systems and recorded more than 50 tremors with magnitude higher than 3.5 in one day. During the following days both the eruptive and seismic activities increased, while the plume rose up to 3 km above the mountain top.
Phreatic eruption at the summit of Mount St. Helens. Picture taken on April 4th 1980. Picture by D.A. Swanson from USGS, public domain
In the first days of April the instruments recorded some low-frequency harmonic tremors. Compared to usual earthquakes caused by sudden energy release from the rocks, the harmonic tremors were associated to volcanic activity. They are usually caused by magma movements under the surface or by gas release from magma. Therefore, they can indicate an imminent eruption. Nevertheless, the wait continued.
On April 3rd the experts noticed a 450 m wide and 90 m deep crater on the northern flank, some fractures visible in the snow and an odd area of exposed terrain, probably the first signs of the bulge. The scientists collected eruptive samples and measured low concentration of sulfide dioxide (SO2), which can indicate sudden magma rise, if found in high concentrations. Water and ice surrounding the crater had formed muddy lakes on the crater floor. When new fluids entered the crater from outside, they warmed up and were ejected as steam and ashes in the atmosphere.
The bulge
The activity seemed to settle in the first half of April: moderate explosions generated small plumes, some harmonic tremors were recorded, fractures on the northern flank extend and the bulge swells. The latter attracted the attention of the experts: at the end of the month it was 1.5 kilometer long, 2.5 kilometers wide and 100 m high. Its origin was a magmatic intrusion into the volcano (cryptodome), that occurred at the end of March. At the end of April its growth rate was 1.5 meter a day. The danger its existence and its fast growth posed was a material (snow, ice and rock) detachment from the flank and a rapid descent along the slope.
Despite the fact the scientists agreed about the danger on the northern flank, nobody knew exactly when it would have happened: the yield of the underlying rocks was unknown as well as the deformation depth. On May 12th a 5.0 magnitude earthquake caused an ice and rock avalanche, validating experts’ concerns.
Few minutes after 8:30 am, a 1.5 East-West fracture opened north of the main crater. The resulting seism caused a detachment of 2.5 cubic kilometers of material from the northern flank and its descent for 14 kilometers. The volume was equal to the sum of a million of olympic swimming pools.
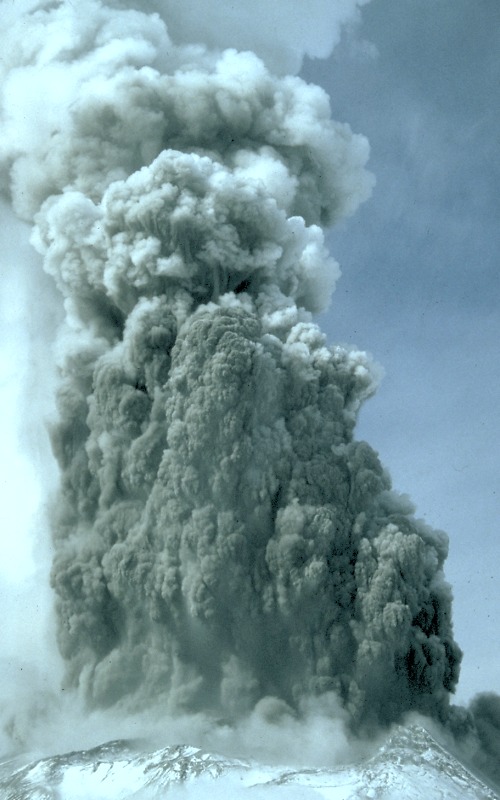
The volume detached from the flank was maintaining pressure on the magmatic system. After the cryptodome removal, the boiling water in the system was transformed into steam and triggered lateral hydrothermal explosions from the fracture exposed by the bulge. The explosion generated an eruptive plume that reached the height of 24 kilometers in less than 15 minutes and a pyroclastic flow that travelled for 8 kilometers at 130 km/h. The flow teared down trees in a 10 km radius.
Trees felled by the horizontal explosion on May 18th 1980. Two USGS geologists at bottom right set the scale. The alignment of the trees indicates the explosion direction (left to right). Picture by Lyn Topinka, shot on September 24th 1980. From USGS Cascade Volcano Observatory, public domain
Moreover, the pyroclastic flow melted part of the ice cap generating several lahars, mud rivers fast flowing towards the valley. The most destructive one travelled up to 80 km from the volcano. The lahars destroyed 27 bridges and almost 200 households.
St. Helens bridge on the Highway State 54 after being devastated by the lahar on May 18th 1980. The structure was dragged for half kilometer and partially buried by the mud. Picture by R.L. Schuster from USGS, public domain
The total amount of victims killed by May 18th 1980 explosions were 57. Most of the population and tourists had been previously evacuated. Because of its magnitude, the eruption has been classified as plinian on the scale of eruption types.
The eruptive event continued until October 1981, characterized by small explosive events with plumes up to 15 km high and pyroclasitc flows from the northern flank. Their products reached metropolitan areas in the states of Washington and Oregon that had not been affected by May 18th eruption.
View of Mount St. Helens from Johnson Ridge before and after May 18th 1980 eruption. The red dotted line shows the volume removed by the explosion. Picture by Harry Glicken, USGS/CVO and Gripso_banana_prune; graphics by Gryphonis, public domain
An USGS geologist observing Mount St. Helens from Coldwater II observation point on May 1st 1980. Unknown author, picture by USGS, public domain
What started out as a hunt for ice lurking in polar lunar craters turned into an unexpected finding that could help clear some muddy history about the Moon’s formation.
Team members of the Miniature Radio Frequency (Mini-RF) instrument on NASA’s Lunar Reconnaissance Orbiter (LRO) spacecraft found new evidence that the Moon’s subsurface might be richer in metals, like iron and titanium, than researchers thought. That finding, published July 1 in Earth and Planetary Science Letters, could aid in drawing a clearer connection between Earth and the Moon.
“The LRO mission and its radar instrument continue to surprise us with new insights about the origins and complexity of our nearest neighbor,” said Wes Patterson, Mini-RF principal investigator from the Johns Hopkins Applied Physics Laboratory (APL) in Laurel, Maryland, and a study coauthor.
This image based on data from NASA’s Lunar Reconnaissance Orbiter spacecraft shows the face of the Moon we see from Earth. The more we learn about our nearest neighbor, the more we begin to understand the Moon as a dynamic place with useful resources that could one day even support human presence. Credits: NASA / GSFC / Arizona State University
Substantial evidence points to the Moon as the product of a collision between a Mars-sized protoplanet and young Earth, forming from the gravitational collapse of the remaining cloud of debris. Consequently, the Moon’s bulk chemical composition closely resembles that of Earth.
Look in detail at the Moon’s chemical composition, however, and that story turns murky. For example, in the bright plains of the Moon’s surface, called the lunar highlands, rocks contain smaller amounts of metal-bearing minerals relative to Earth. That finding might be explained if Earth had fully differentiated into a core, mantle and crust before the impact, leaving the Moon largely metal-poor. But turn to the Moon’s maria — the large, darker plains — and the metal abundance becomes richer than that of many rocks on Earth.
This discrepancy has puzzled scientists, leading to numerous questions and hypotheses regarding how much the impacting protoplanet may have contributed to the differences. The Mini-RF team found a curious pattern that could lead to an answer.
Using Mini-RF, the researchers sought to measure an electrical property within lunar soil piled on crater floors in the Moon’s northern hemisphere. This electrical property is known as the dielectric constant, a number that compares the relative abilities of a material and the vacuum of space to transmit electric fields, and could help locate ice lurking in the crater shadows. The team, however, noticed this property increasing with crater size.
For craters approximately 1 to 3 miles (2 to 5 kilometers) wide, the dielectric constant of the material steadily increased as the craters grew larger, but for craters 3 to 12 miles (5 to 20 kilometers) wide, the property remained constant.
“It was a surprising relationship that we had no reason to believe would exist,” said Essam Heggy, coinvestigator of the Mini-RF experiments from the University of Southern California in Los Angeles and lead author of the published paper.
Discovery of this pattern opened a door to a new possibility. Because meteors that form larger craters also dig deeper into the Moon’s subsurface, the team reasoned that the increasing dielectric constant of the dust in larger craters could be the result of meteors excavating iron and titanium oxides that lie below the surface. Dielectric properties are directly linked to the concentration of these metal minerals.
If their hypothesis were true, it would mean only the first few hundred meters of the Moon’s surface is scant in iron and titanium oxides, but below the surface, there’s a steady increase to a rich and unexpected bonanza.
Comparing crater floor radar images from Mini-RF with metal oxide maps from the LRO Wide-Angle Camera, Japan’s Kaguya mission and NASA’s Lunar Prospector spacecraft, the team found exactly what it had suspected. The larger craters, with their increased dielectric material, were also richer in metals, suggesting that more iron and titanium oxides had been excavated from the depths of 0.3 to 1 mile (0.5 to 2 kilometers) than from the upper 0.1 to 0.3 miles (0.2 to 0.5 kilometers) of the lunar subsurface.
“This exciting result from Mini-RF shows that even after 11 years in operation at the Moon, we are still making new discoveries about the ancient history of our nearest neighbor,” said Noah Petro, the LRO project scientist at NASA’s Goddard Space Flight Center in Greenbelt, Maryland. “The MINI-RF data is incredibly valuable for telling us about the properties of the lunar surface, but we use that data to infer what was happening over 4.5 billion years ago!”
These results follow recent evidence from NASA’s Gravity Recovery and Interior Laboratory (GRAIL) mission that suggests a significant mass of dense material exists just a few tens to hundreds of kilometers beneath the Moon’s enormous South Pole-Aitken basin, indicating that dense materials aren’t uniformly distributed in the Moon’s subsurface.
The team emphasizes that the new study can’t directly answer the outstanding questions about the Moon’s formation, but it does reduce the uncertainty in the distribution of iron and titanium oxides in the lunar subsurface and provide critical evidence needed to better understand the Moon’s formation and its connection to Earth.
“It really raises the question of what this means for our previous formation hypotheses,” Heggy said.
Anxious to uncover more, the researchers have already started examining crater floors in the Moon’s southern hemisphere to see if the same trends exist there.
LRO is managed by NASA’s Goddard Space Flight Center in Greenbelt, Maryland for the Science Mission Directorate at NASA Headquarters in Washington. Mini-RF was designed, built and tested by a team led by APL, Naval Air Warfare Center, Sandia National Laboratories, Raytheon and Northrop Grumman.


.jpg#/media/File:456955_Mount_St._Helens_Before_Eruption,_GPNF,_WA_(21418557043).jpg)
.jpg)